
Pity the plight of the central banks. Already struggling to come to terms with the way in which hundreds of basis points of rate hikes are failing to slow the economy in the way they had previously anticipated, now new and seemingly comprehensive research lands on their desks informing them that quantitative tightening has had barely any impact either. To quote from the research paper, “the effects of QT have been very small (or nonexistent) on average, statistically insignificant to date, and much less than the impact of QE (in reverse).”1
It is easy to see why they are confused. Over the past year, central banks have somehow managed to achieve a remarkable easing in financial conditions while purporting to tighten policy through both ongoing QT and through rate hikes. No wonder they are starting to think that neutral rates must have risen, or that QT somehow has no effect even when QE does. We think both suggestions are mistaken.2
There is a much more intuitive reason why risk keeps on rallying, and why the economy has been little affected by rate hikes, especially in the US – one which explains the research paper’s findings also. It is not that QT works asymmetrically, that more rate tightening is required as a result, and that markets are somehow impervious to it. It is that balance sheet policy is more powerful than central banks recognize, that they have been mismeasuring it, and that they have barely been tightening it at all. Indeed, since the recent low in equities in late October, we calculate that the Fed has actually eased balance sheet by $340bn; since late September they have eased by nearly $500bn.


The irony is that the paper is actually an extremely good and careful piece of research – but to our minds its very desire for thoroughness prevents it from drawing the proper conclusions. The tragedy is that the misunderstandings it propagates about how balance sheet dynamics affect markets greatly increase the likelihood of future policy mistakes. The real asymmetry is not in how markets respond to central bank policy; it is in how central banks respond to moves in markets.
This note consists of five parts. First, we describe the four false assumptions we think often prevent a proper analysis of QE and QT. Second, we try to trace the impact of QT on bond yields once these are corrected for – and explain why most of the time it is easier to look for the impact directly in risk assets rather than in bond yields. Third, we draw on experience in emerging markets to explain why the right metric to measure balance sheet policy is not securities holdings but bank reserves. Fourth, we try and retrace some of how this must work by re-examining the paper’s findings in money markets. Finally (but probably of greatest interest to most market participants), we consider what all this means for the outlook.
Easier to understand practice than theory
Central bankers themselves seem surprised by the asymmetry of the paper’s findings, even though the authors themselves clearly consider the case closed.3 Attendees at a conference convened largely to discuss them came up with a variety of unconvincing excuses. Some suggested “not to take the results … seriously or literally”.4 Lorie Logan, president of the Dallas Fed, hypothesized that markets were better at anticipating the announcement of QT than QE – even though the study dedicated an appendix to this possibility and found no difference between the 11 QT events that involved a large “surprise” component and the 27 where it was better anticipated. She also suggested – to our minds equally unpersuasively – that the asymmetry in outcomes simply reflects an asymmetry in circumstances under which the initial announcements are made: “central banks don’t use QT when it would have large liquidity effects.”5
Once again, we think there is an easier explanation. The academic literature on QE has to our minds been blighted by four theoretically well founded assumptions which in practice prove obfuscatory. The recent paper’s authors are so thorough that on multiple occasions they seem on the verge of overcoming these and drawing what we consider the right conclusions – only to pull back. Bernanke was right.6 It’s not that QT is somehow different from QE: it’s that it’s much easier to understand what’s going on if you simply allow the data to speak for itself than to trace through all the underlying theory.
1. Implementation, not announcement
A large majority of QE studies focus on markets’ response during an extremely short time period following initial announcement dates. While this may fit with the theory of efficient markets, to the extent to which this ever held in practice, we think it was completely undermined by the arrival of Basel 3 constraints on leverage. This is particularly true when it comes to assessing the impact on less liquid asset classes.7 To the authors’ credit, the study looks at implementation impact as well as announcements – but sadly only for government bond yields.
2. Risk assets, not nominal yields
However logical it may seem to look for the impact of QE and QT on government bond yields – this is, after all, the majority of what central banks have been buying and selling – in our experience the effects are much more obvious in risk assets. We think there is a straightforward reason for this, discussed further below: in govies the portfolio balance effect of lower [real] yields from QE is often counteracted by a positive signalling effect on inflation breakevens, making the impact on nominal yields particularly hard to interpret. In credit and equities, portfolio balance dominates, and acts only in one direction. Again, the authors to their credit do consider this possibility – but only around announcement dates and in money market spreads, not for risk assets more broadly.


3. Reserves, not securities
The most straightforward way of measuring QE and QT is through securities holdings on the asset side of central bank balance sheets, or conceivably through their total balance sheet sizes. In the early years of QE, this seemed to do a perfectly good job – but over the past five years or so it has become increasingly apparent that markets are much better correlated with reserves.8 In the US, in particular, this makes a significant difference.
Once again, the authors do at multiple stages consider changes in “bank liquidity balances” rather than just changes in securities holdings, and note how little reserves have declined under the Fed’s QT2 (year-to-date, Fed reserves are up $180bn). But in their adherence to looking for a “kink” between the point where reserves merely adequate and where they become abundant, they blind themselves to the more continuous impact that reserves levels have on risk asset pricing through portfolio balance effects.
We also think the fact that the market correlations generally work best with reserves – and are clearly buffeted by factors other than simple central bank securities acquisition and run-off – is extremely revealing of the mechanisms which must be at work here. It is not signalling – or investors repricing risk assets in response to changes in interest rates – but liquidity and portfolio balance which are at work. When the private sector suddenly finds it has less money and more assets to invest it in, this is reflected in the price of risk. Empirically it seems to make little difference whether this is achieved through securities rolling off the asset side of central bank balance sheets and being refinanced by the private sector in conventional QT, or governments issuing more bills or bonds and depositing the proceeds on the liability side of the central bank balance sheet, or US money market funds choosing not to buy T-bills and depositing the proceeds in RRP. All affect the balance between private sector “money” and assets available to absorb it; all can be captured by looking at reserves rather than at securities; all have a demonstrable impact on the price of risk. We re-examine these mechanisms below.
4. Global, not local
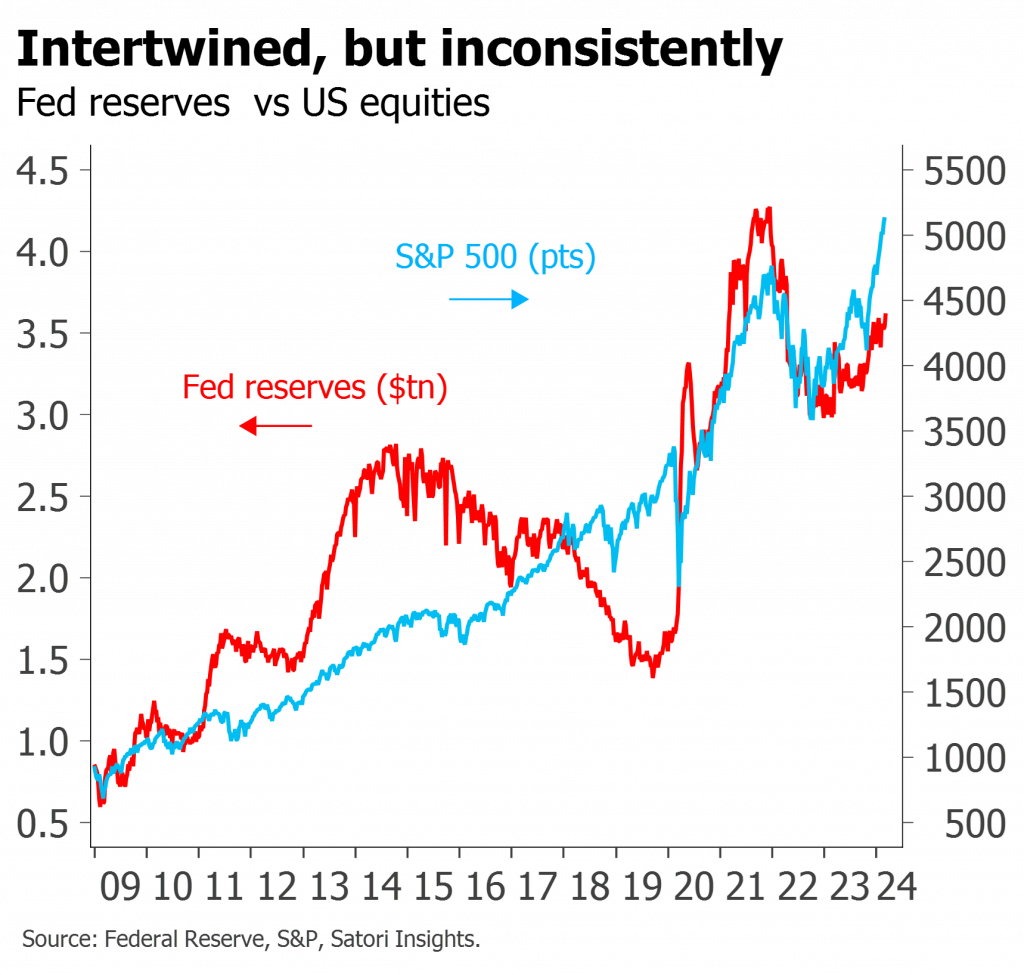
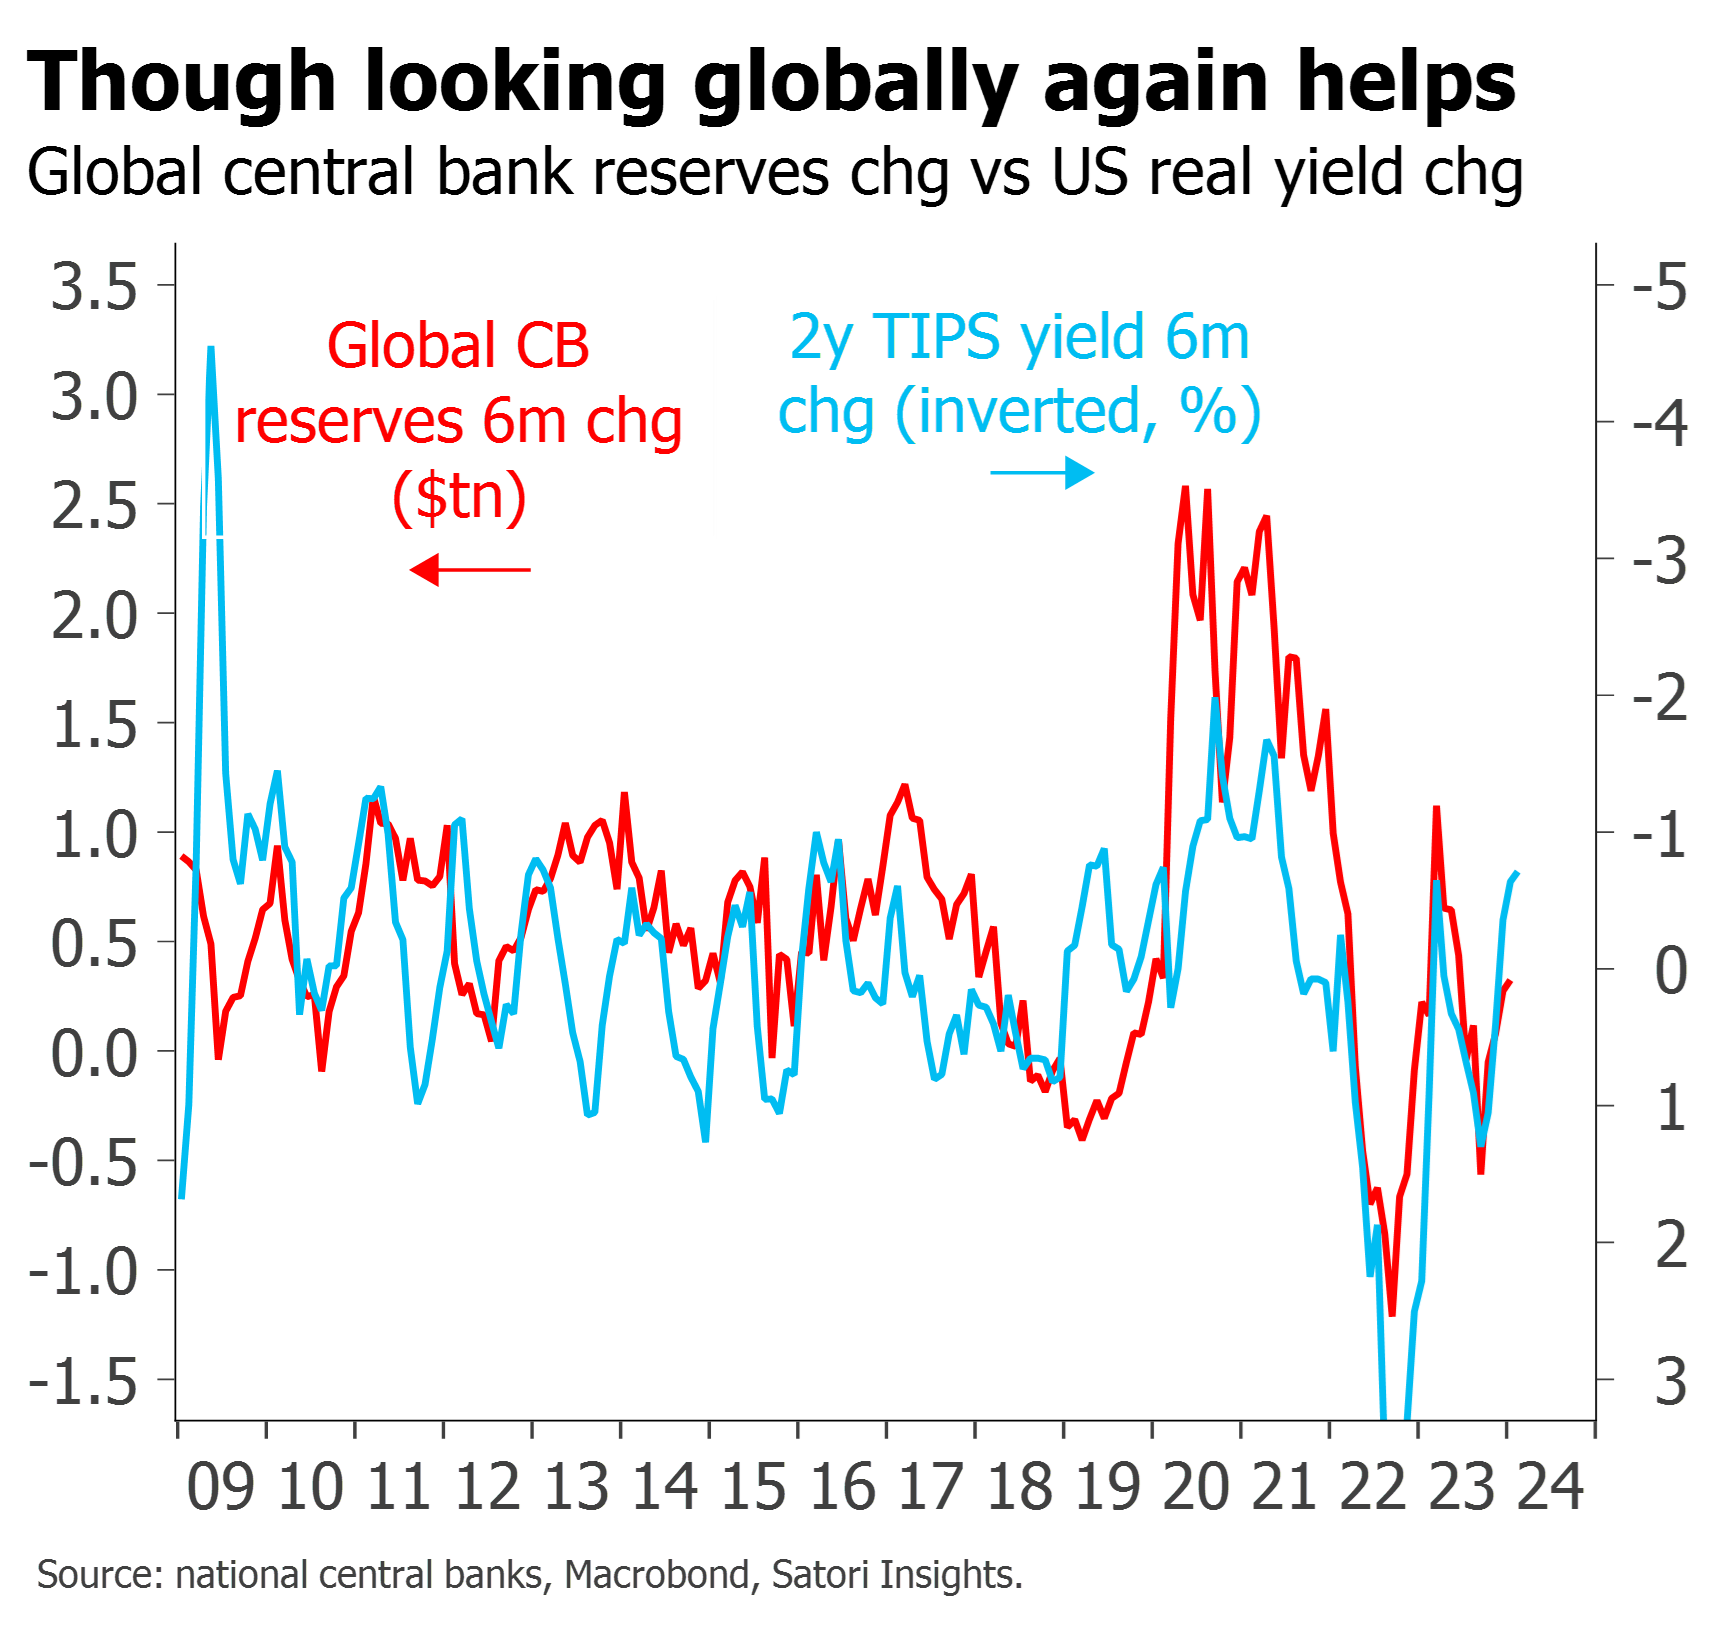
The final factor to which the authors fail to attribute sufficient weight is the importance of global factors relative to local ones, and indeed of a global aggregate liquidity impact.9 We have long observed that single-market correlations can appear to come and go – as in the case of simple plots of Fed reserves vs equities – or that non-US assets have often been better correlated with Fed reserves changes than with central bank liquidity in their own jurisdiction. We prefer to show single-market effects where we can – they have the obvious virtue of simplicity – but more often than not, and especially over extended time periods, global metrics work better.

This distinction is not only relevant when looking at smaller markets, but also in evaluating the impact of the Fed’s first round of QT, from 2017-19. We think the idea that “QT doesn’t seem to have the same impact as QE” initially gained traction based on US-specific studies from this period. But global liquidity conditions over the period were heavily influenced by ongoing ECB and BoJ QE – which in most cases these studies completely fail to consider. For Europe in particular, the impact of ECB QE – on US assets – is clearly visible in the balance of payments over the period, with Euro area bond investors being crowded into assets like US credit. Once ECB and BoJ QE were wound down in 2019, these flows ceased and risk assets corrected. To our minds this drop in global liquidity flows – and not some sudden discovery that the level of “adequate” reserves was much higher than previously anticipated – was at a minimum an underappreciated factor behind the repo market turmoil of September 2019.


Note that in arguing for a global analysis we are not for a moment suggesting that FX effects be incorporated. Changes in currencies are an inevitable complication when considering global effects, and will obfuscate correlations with risk assets unless explicitly controlled for. Fortunately this is easy to do – by looking at changes or flows in local currency, and only then converting to dollars – but the whole analysis of global “liquidity” has to our minds been tainted by people failing to control for, or even deliberately including, currency effects in their global numbers.
The impact on yields is confusing – but still visible
With these four factors in mind, we can re-examine some of the paper’s findings and hopefully make better sense of them.
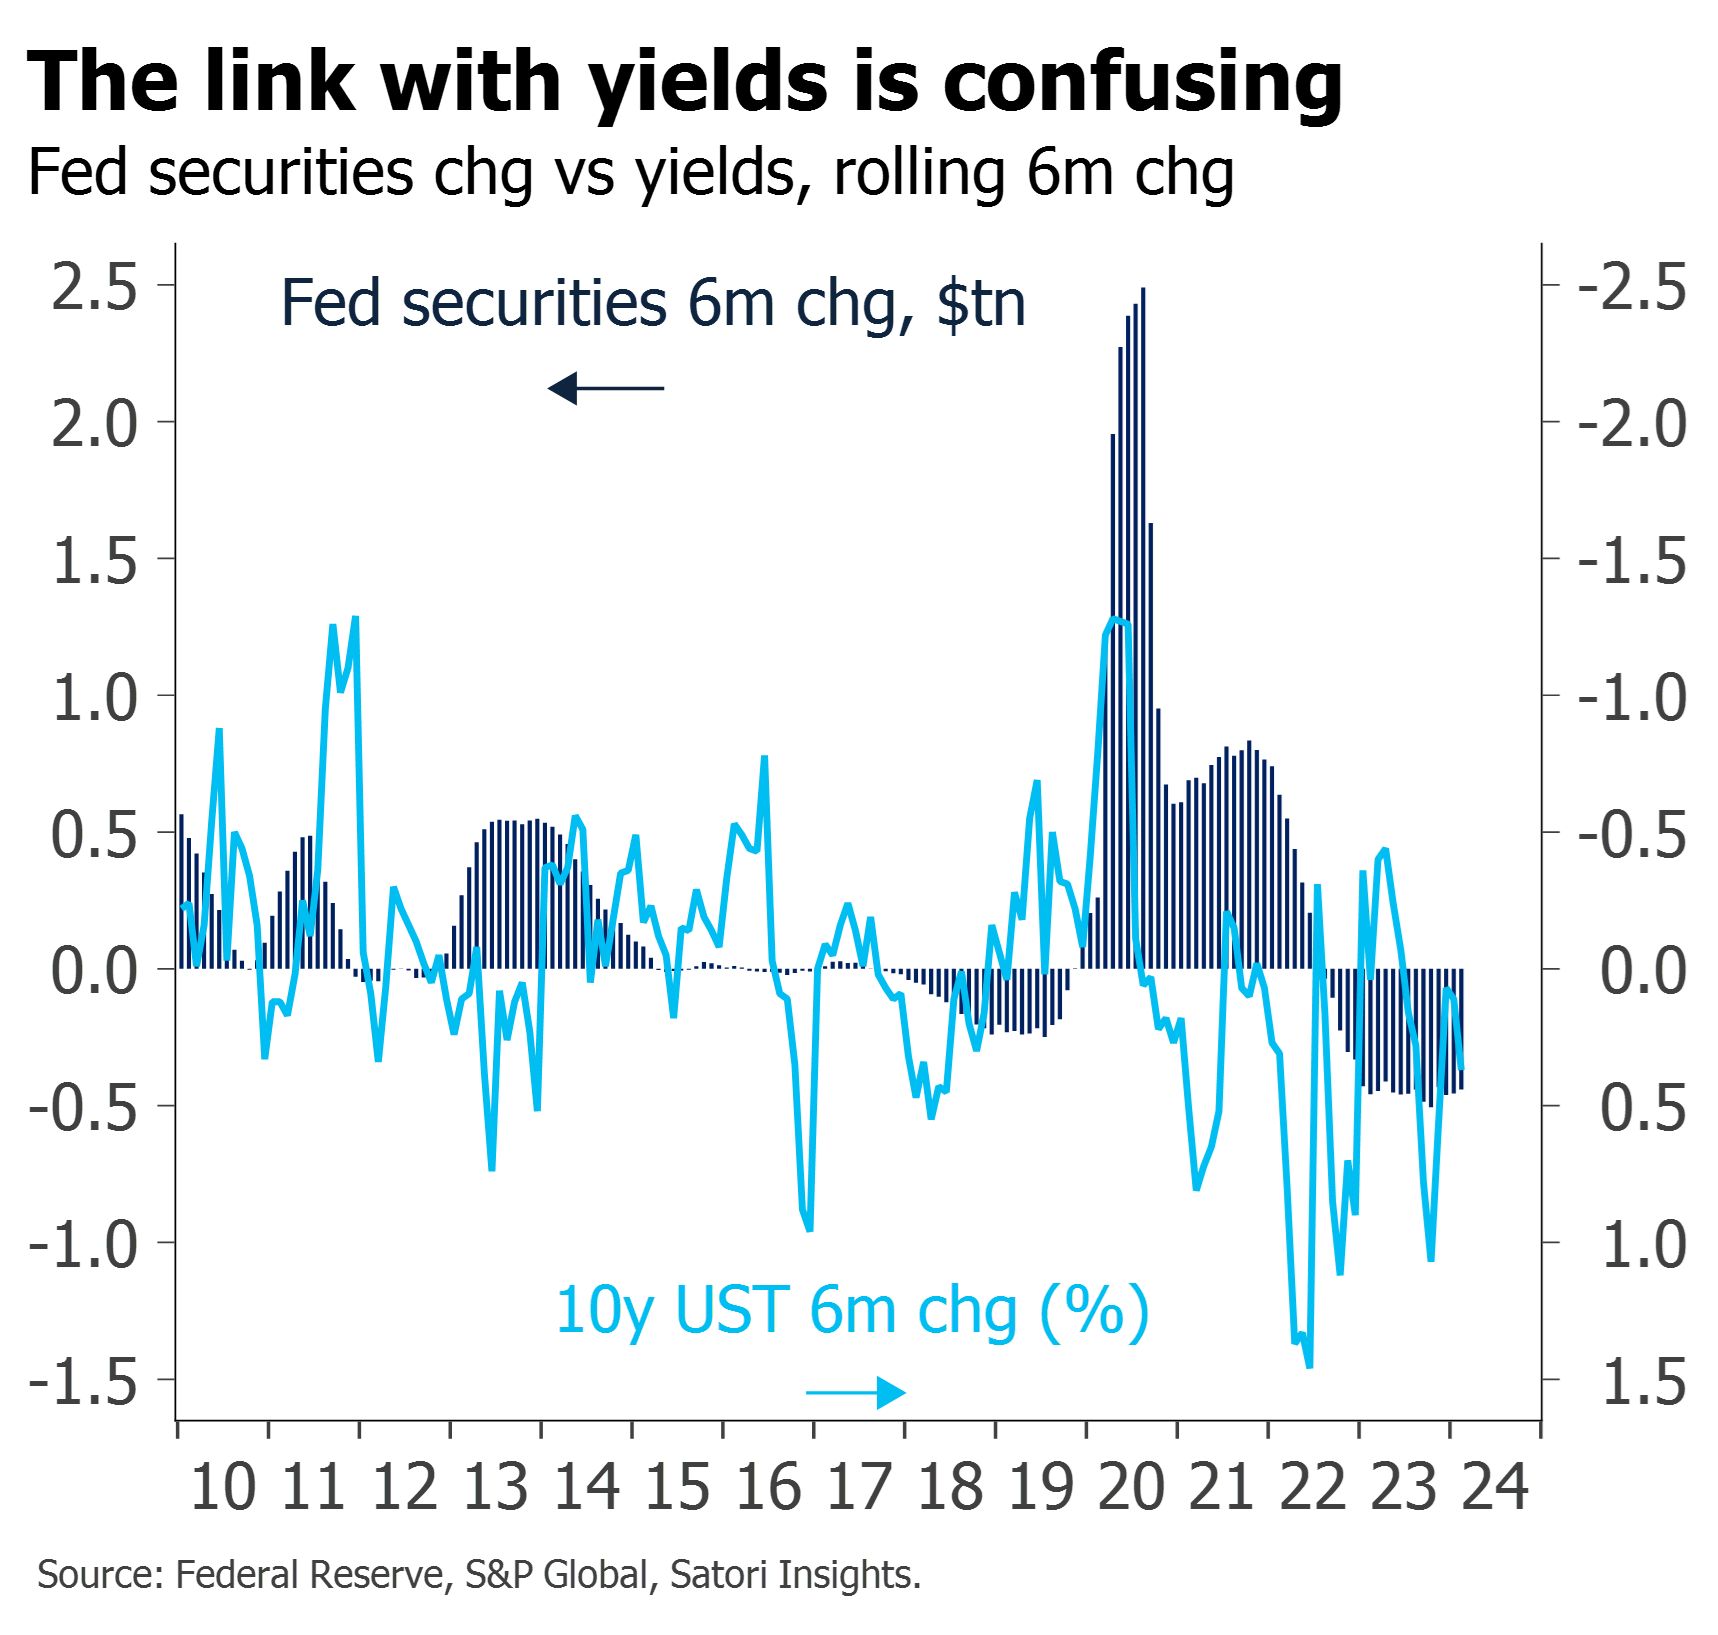
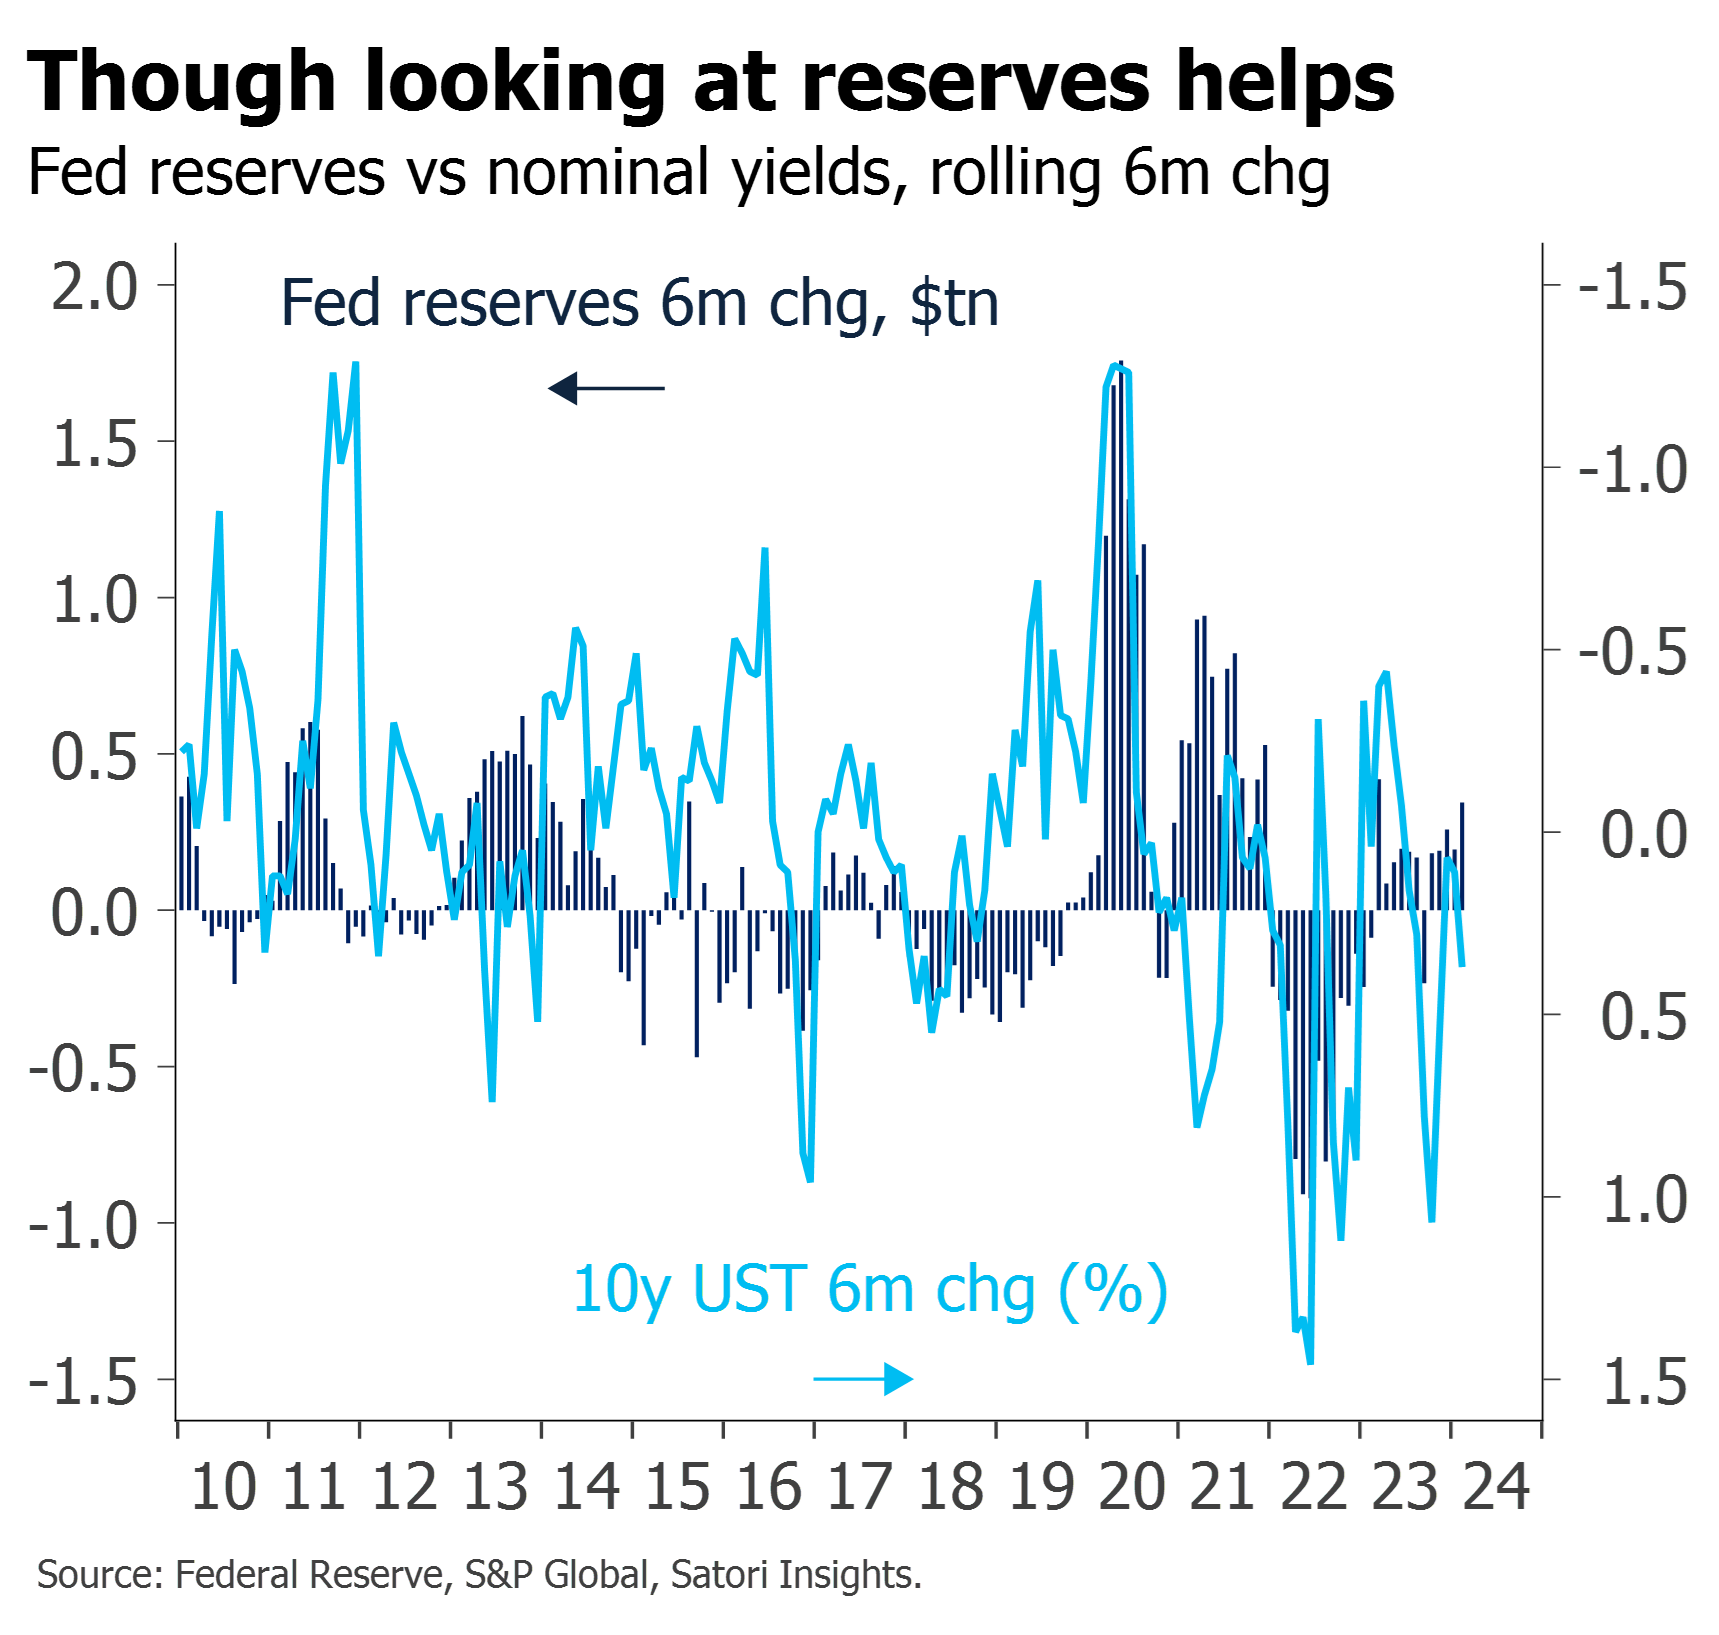
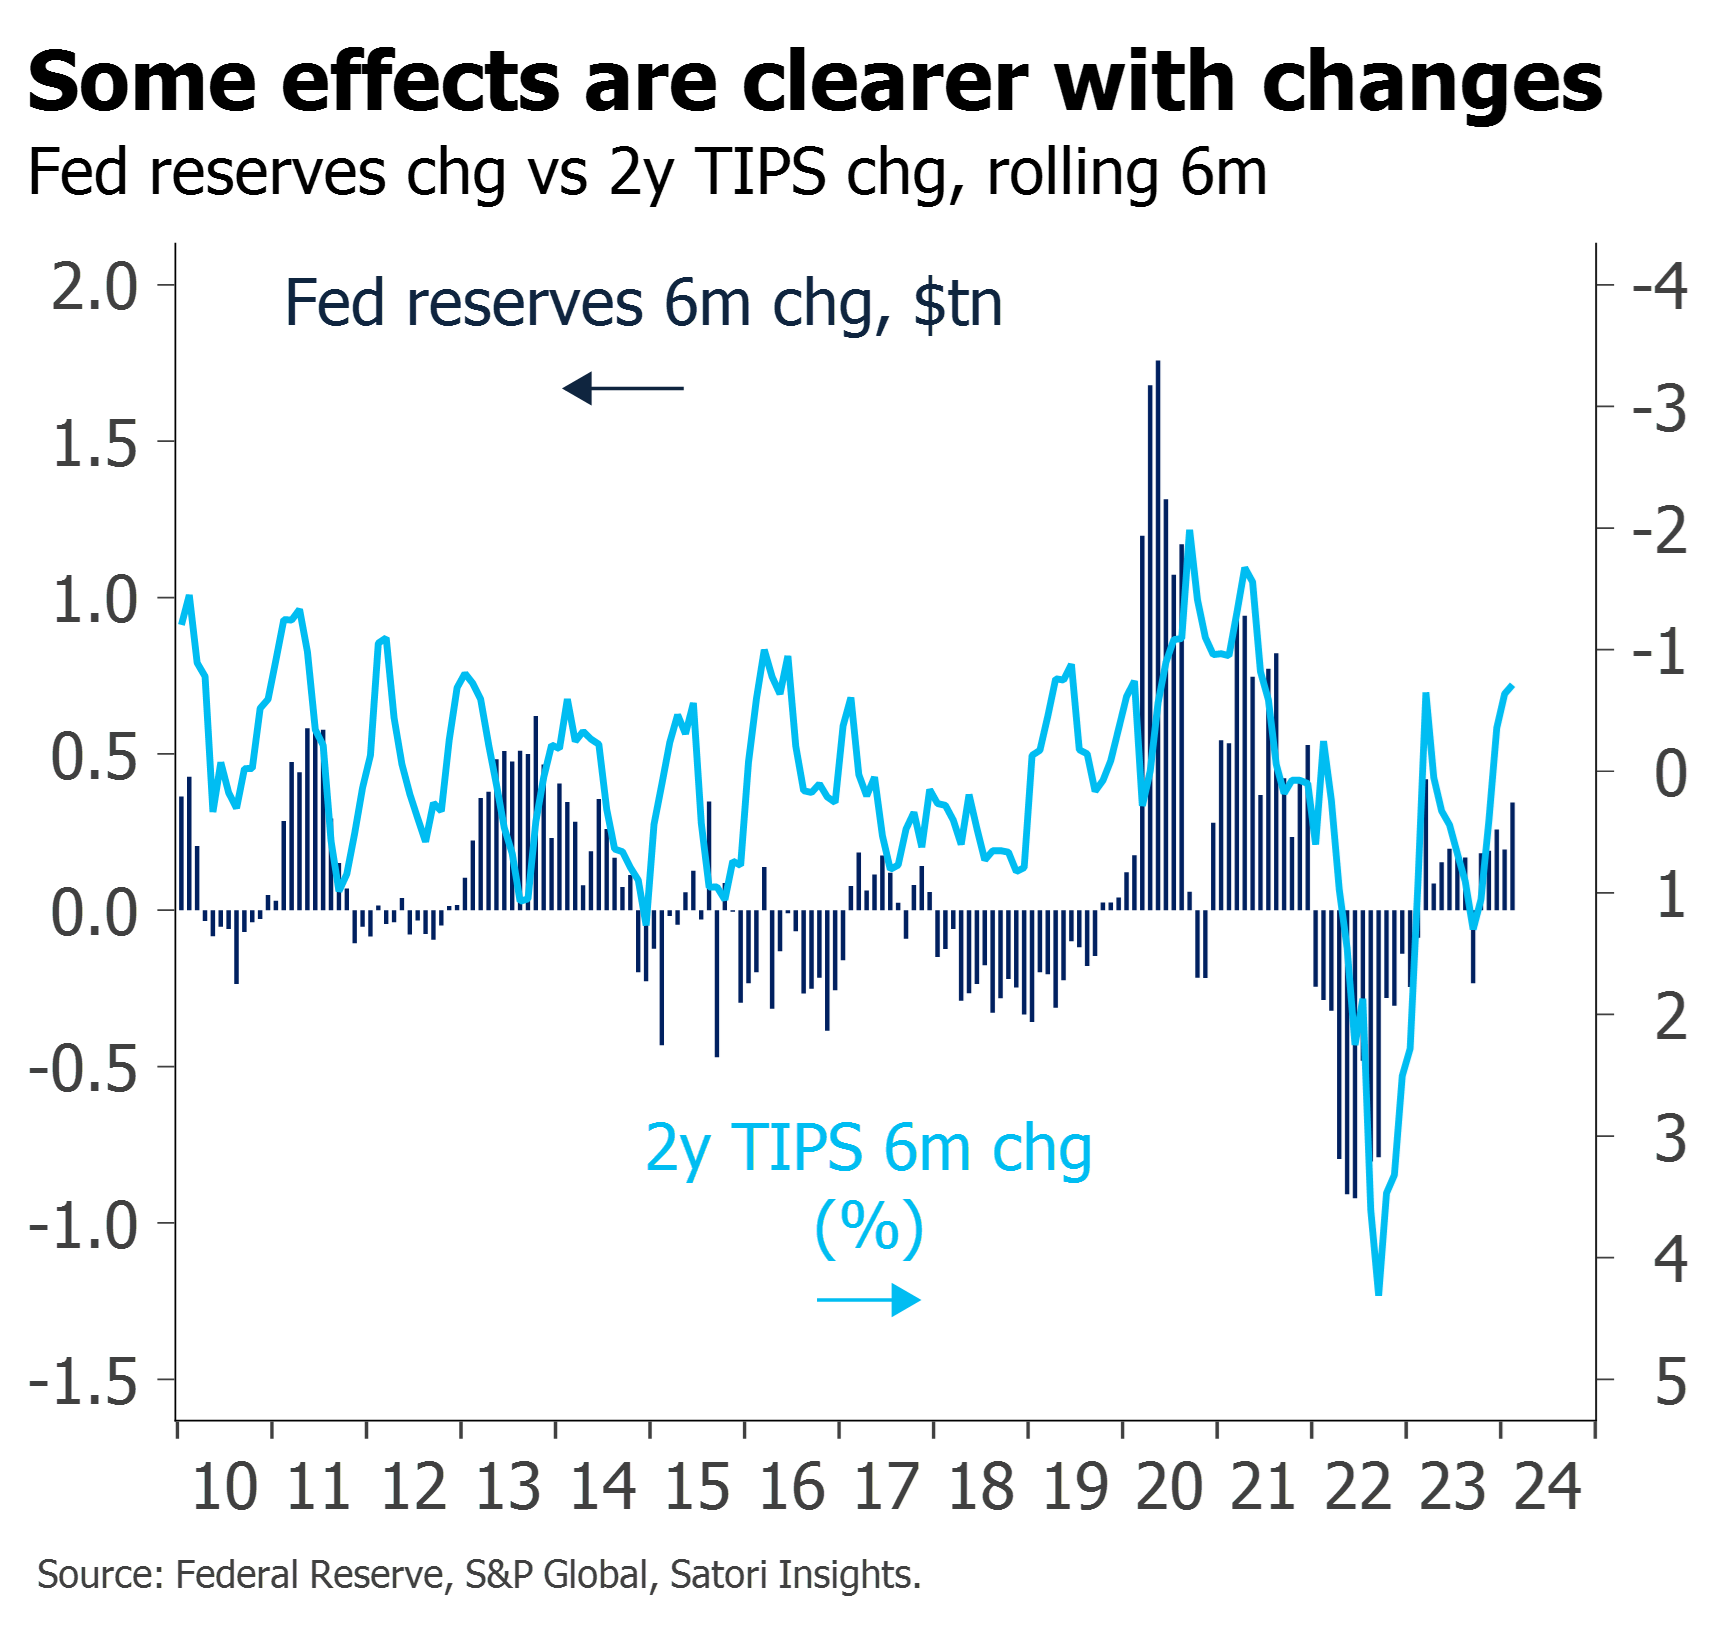
Even when allowing for implementation effects, the link between QE, QT and nominal yield moves is far from apparent. Looking at reserves changes rather than securities helps, but even here, the effects seem inconsistent: positively correlated in recent years, but almost negatively correlated at times in 2012-18.
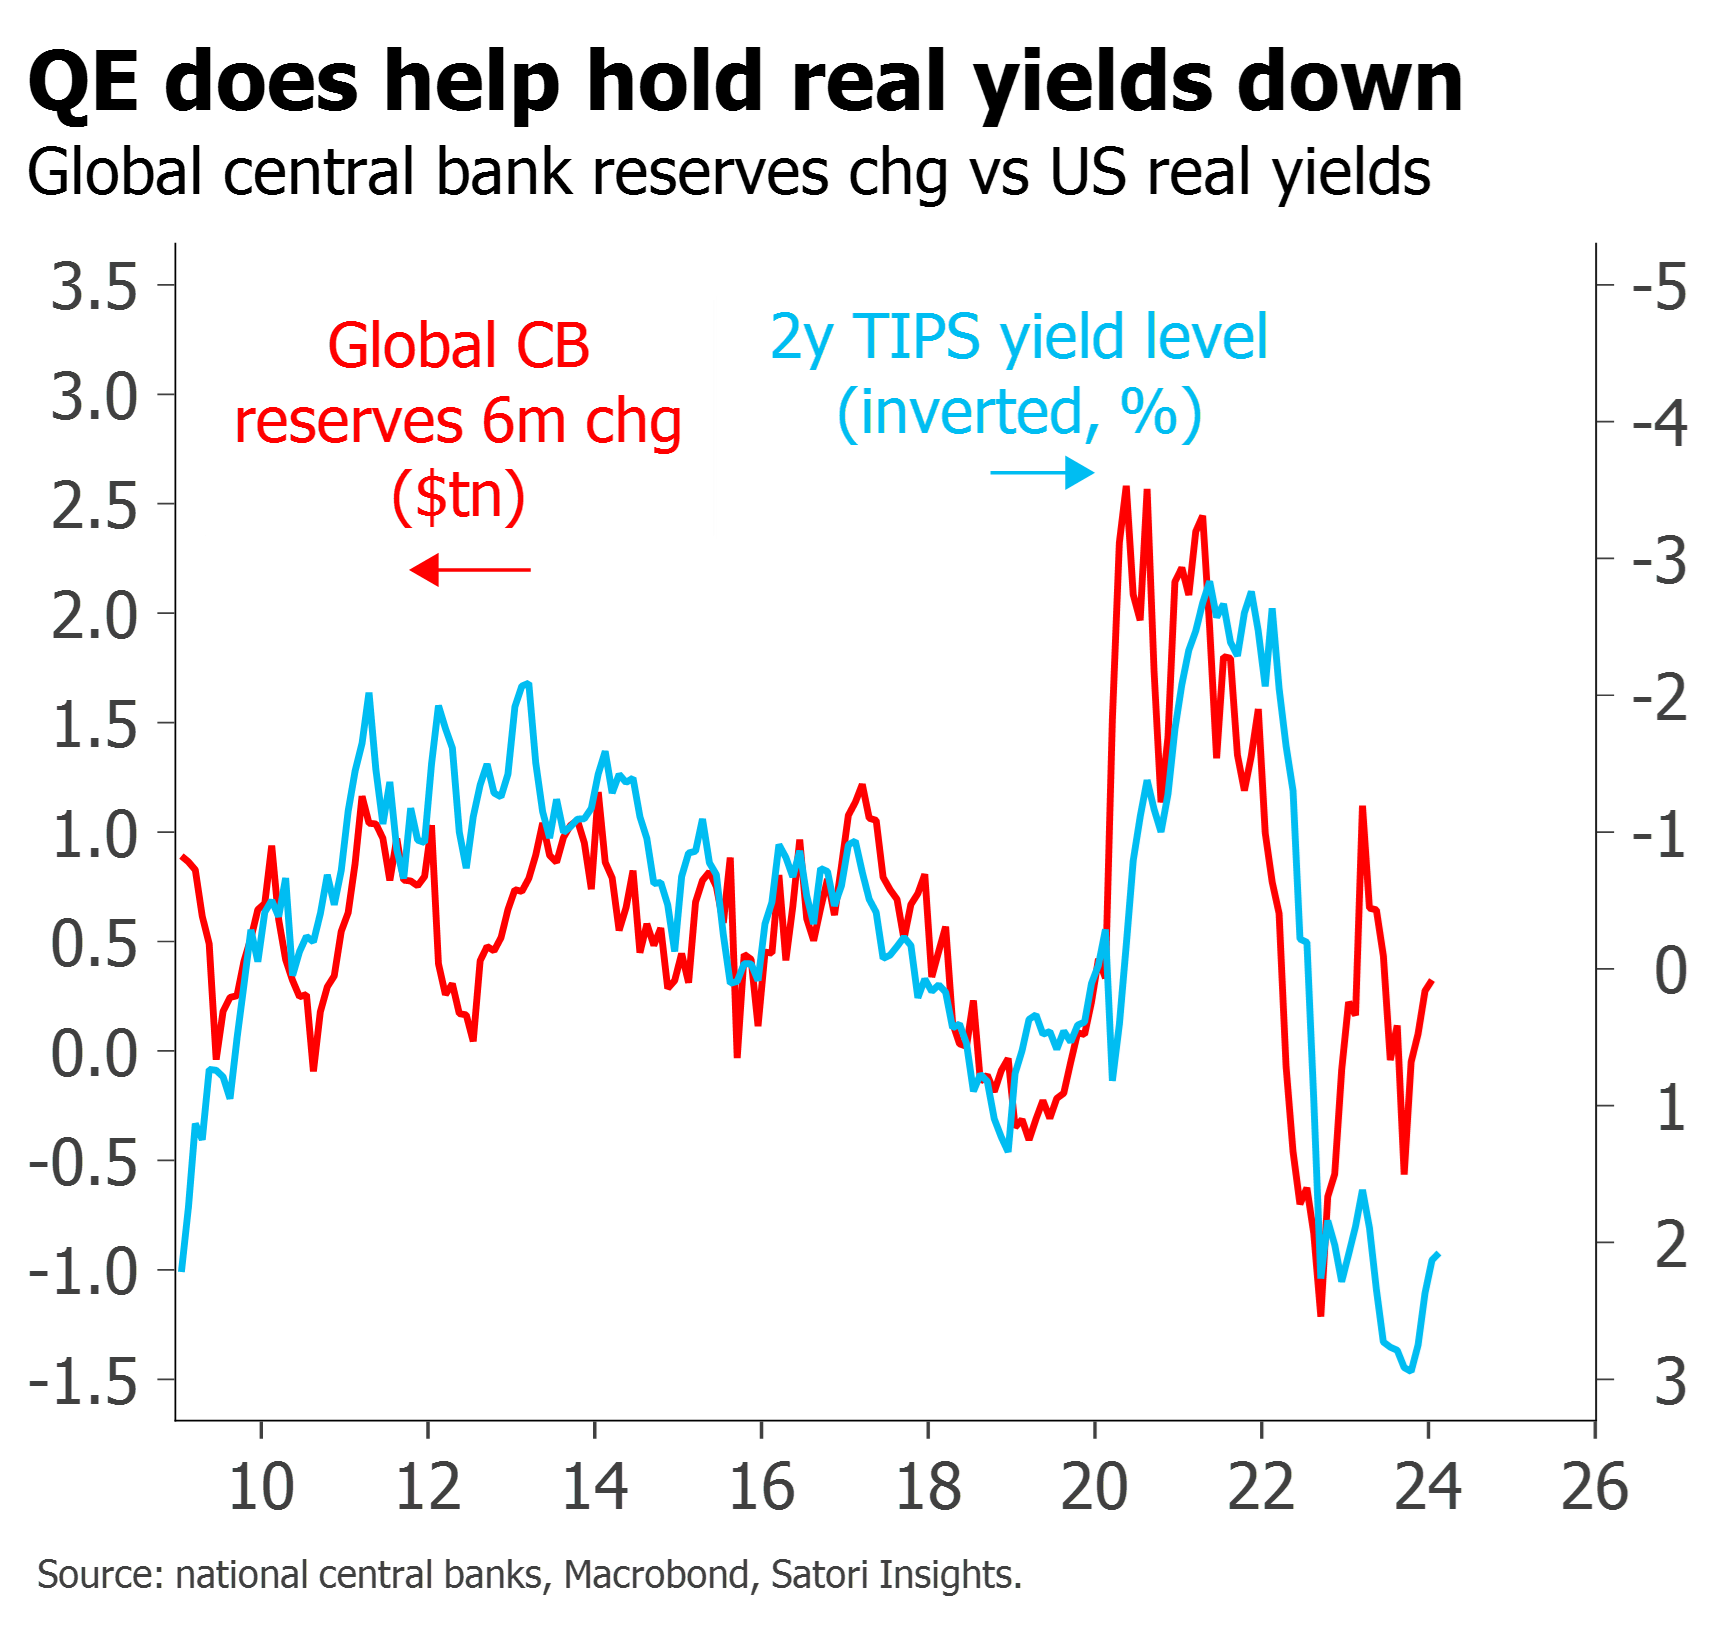
Things start to become clearer if we break down the nominal yield move into the impact on real yields and the impact on inflation breakevens. QE does hold down real yields – and QT allow them to rise, in a broadly symmetrical fashion. But there is an opposing effect through signalling on inflation breakevens, which has offset and at times (from 2012-18) exceeded this: QE tends to be associated with rises in inflation breakevens, while QT or liquidity withdrawal tends to see them fall.
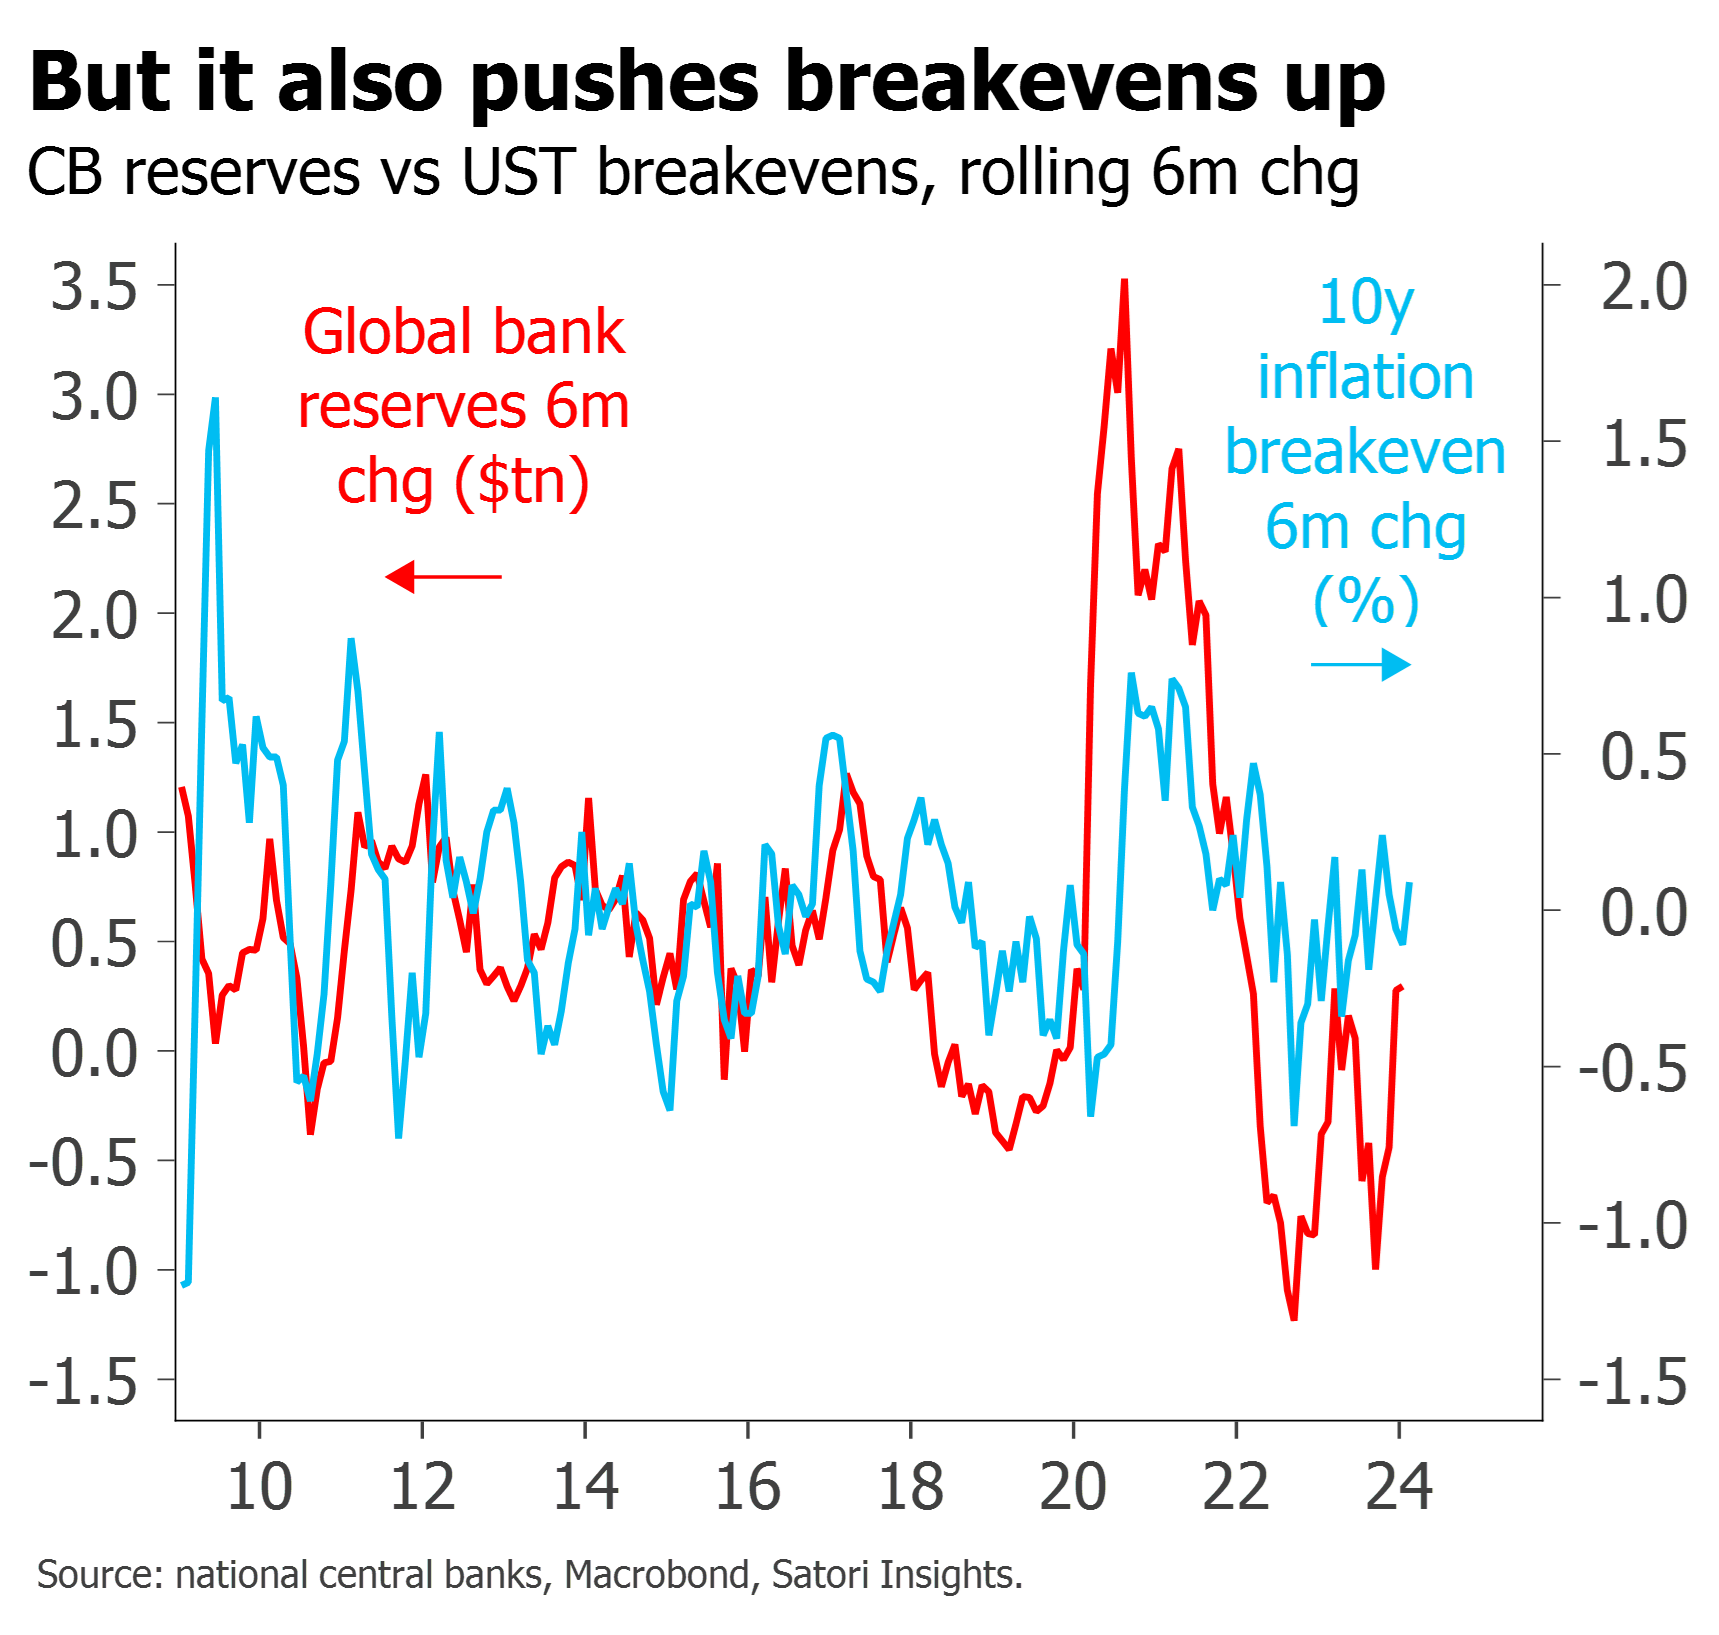
Central bank liquidity operations are, of course, far from being the only factors impacting real yields and inflation breakevens. Policy rate changes, fiscal policy and global economic dynamics all matter too. The lag time with which reserves changes feed through into markets also seems to vary. But this is precisely why we think a slightly looser approach – allowing for global factors, and not just looking purely at two-day announcement effects – is the right one, and we find it remarkable that such clear relationships remain visible regardless. There might, of course, be some common factor driving both reserves changes and market moves, or the latter may be influencing the former – but most of the time the slight lead with which reserves seem to drive markets would argue against this.
We would acknowledge that this leads to some conclusions which may seem counterintuitive to those thinking QE must act primarily through yield levels. Term premium, in particular, is usually thought to be suppressed by QE and to have risen under QT – but thinking in terms of global reserves changes casts doubt on this, and may even suggest the opposite. Likewise, QE is usually thought to contribute to flattening of yield curves and QT to contribute to steepening – but global reserves changes suggest the opposite.
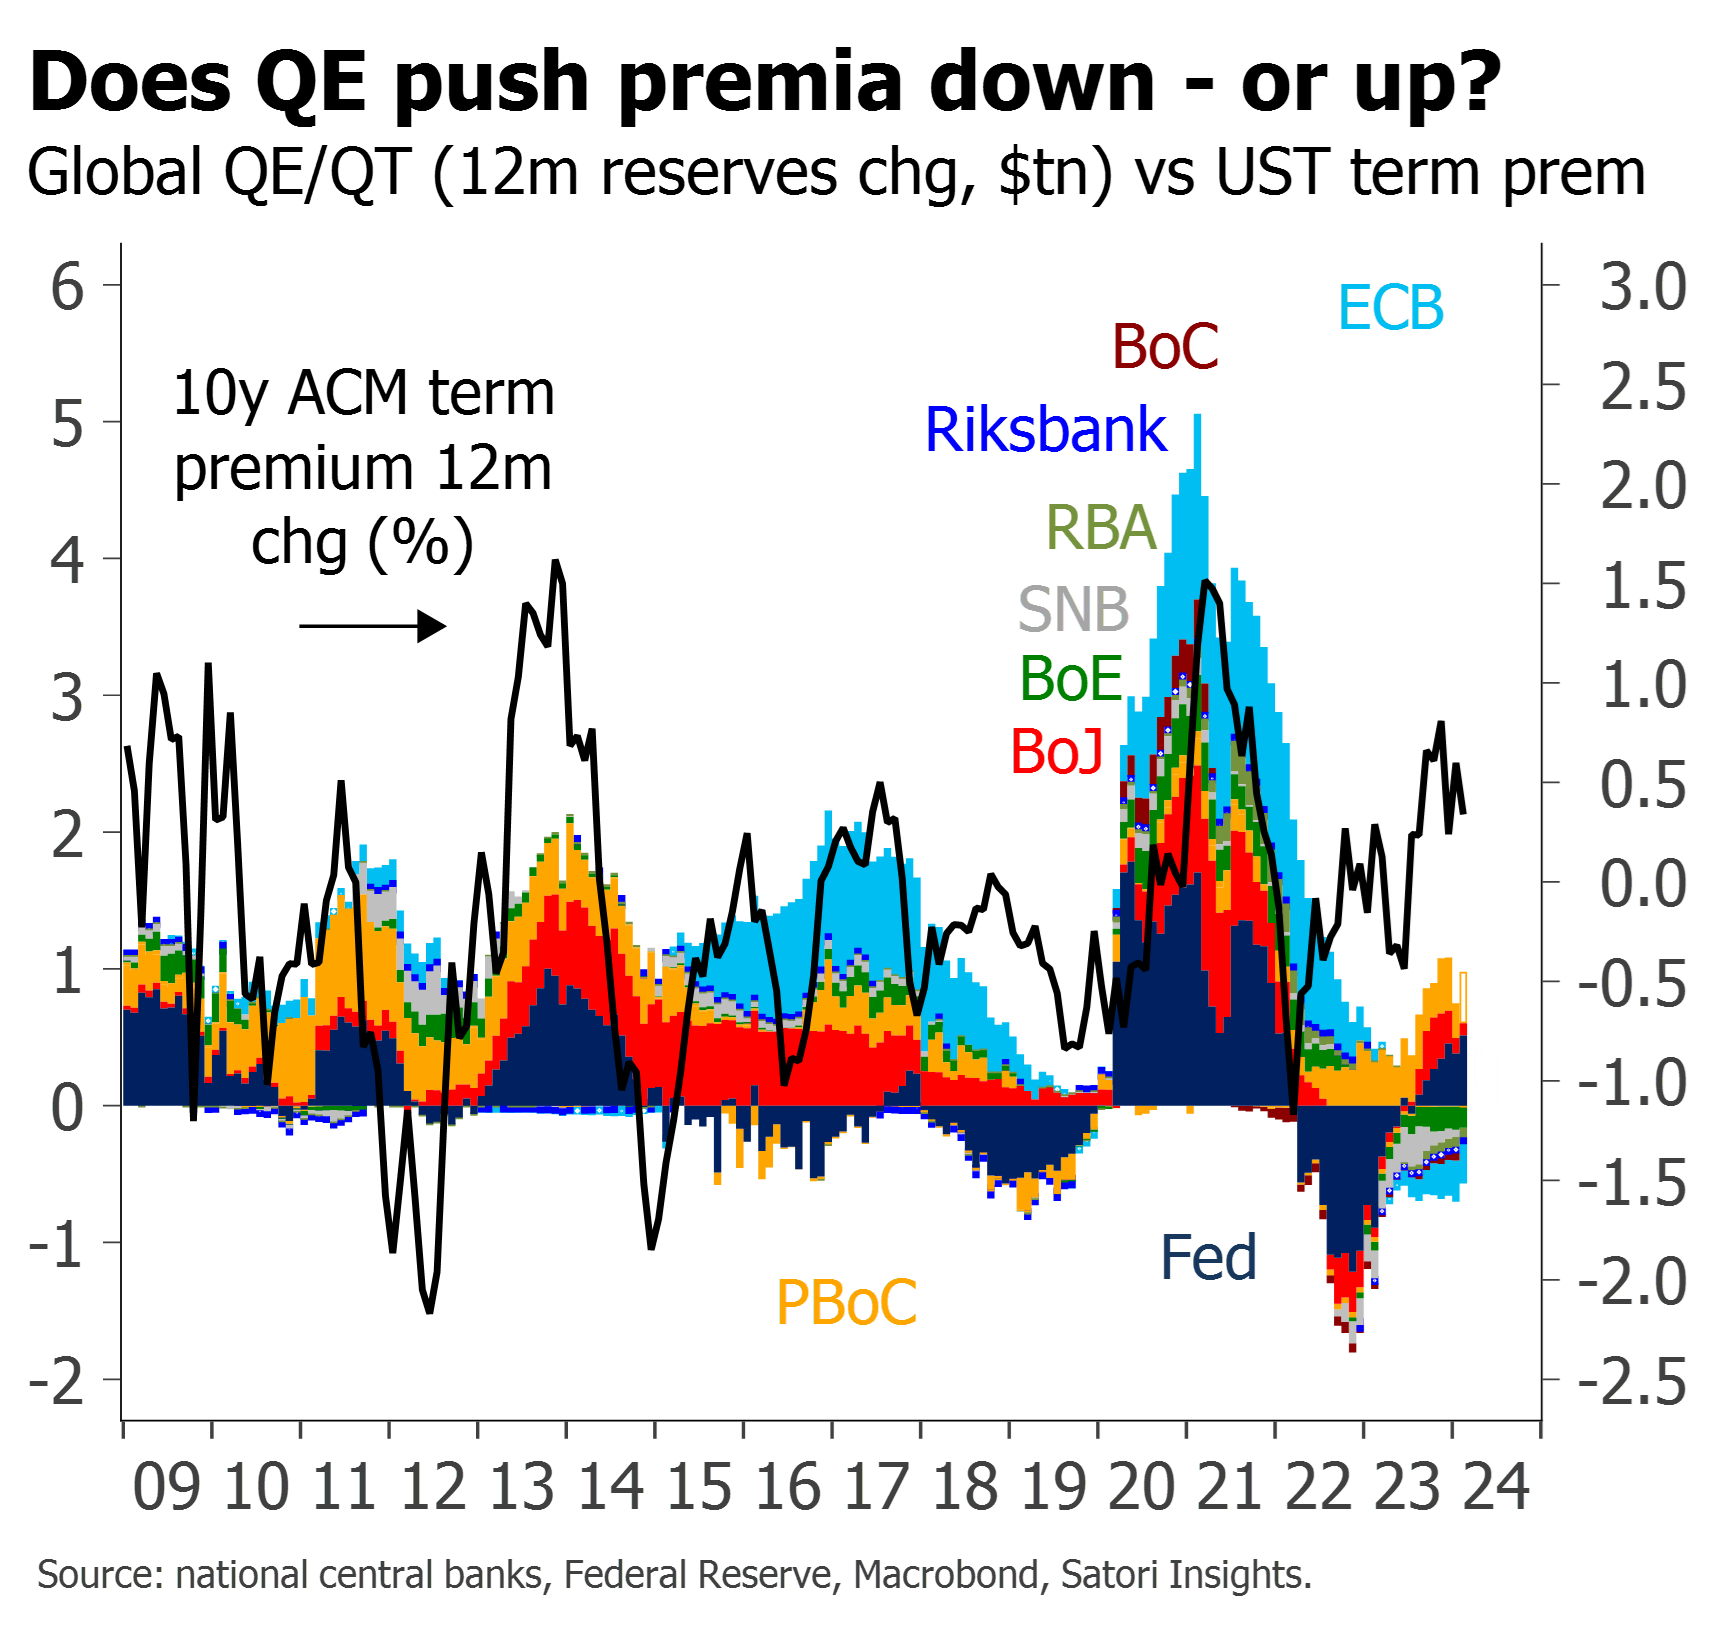
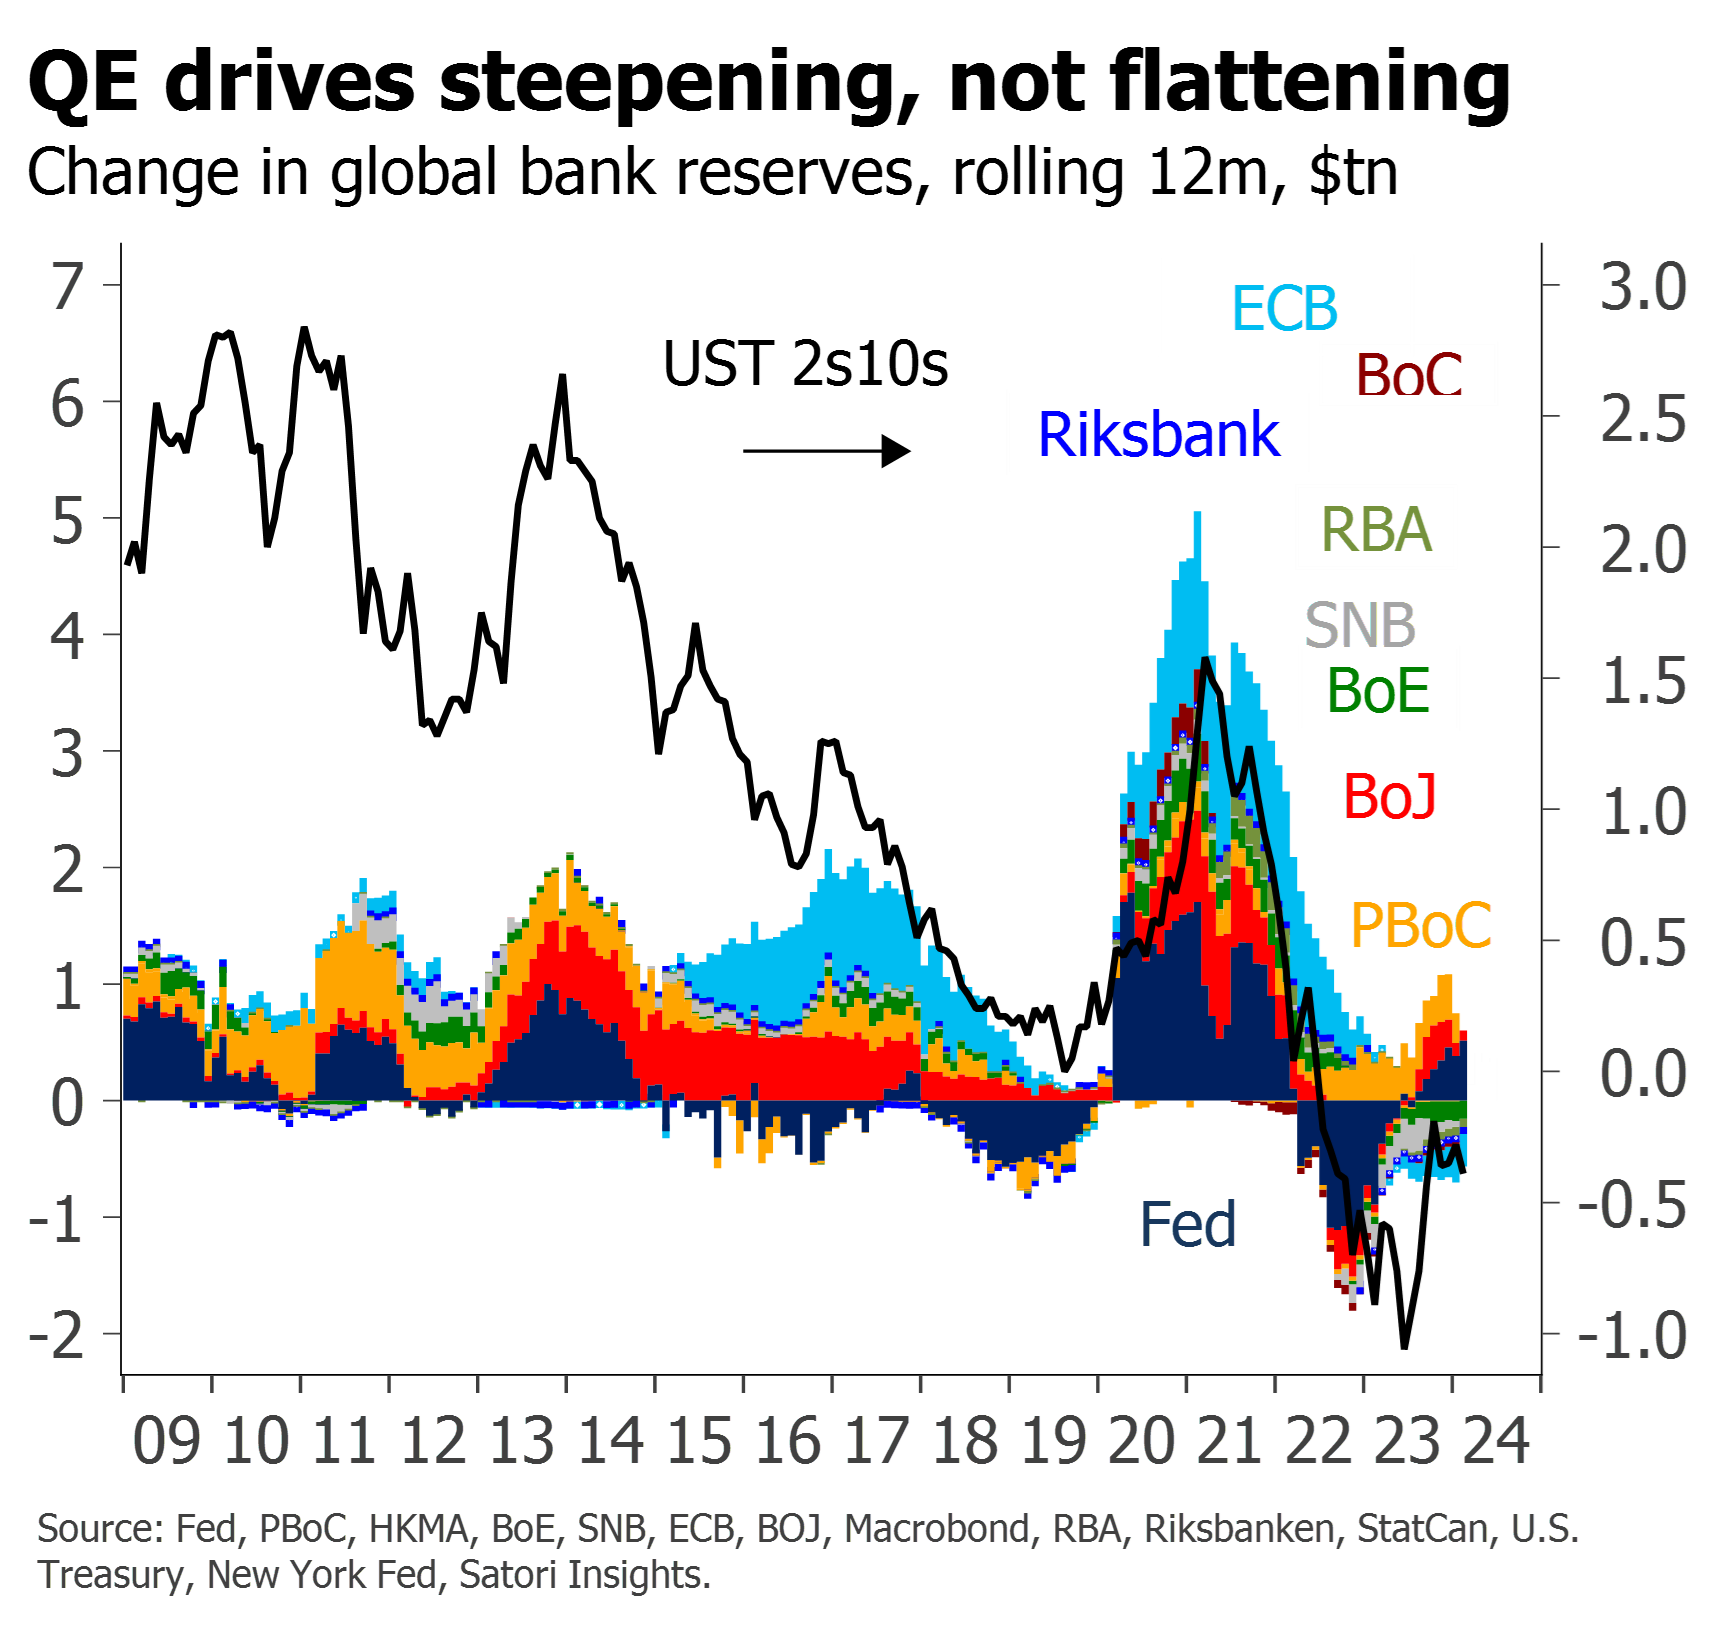
A moment’s reflection – and a proper consideration of the role of portfolio balance effects and the stronger link with risk assets – may explain this. If, first and foremost, central bank liquidity addition pushes up the price of risky assets and liquidity drainage causes them to fall, then it is less surprising that liquidity addition is associated with nervousness about future duration risk and vice versa. Put differently, the positive impact through signalling on curve steepness, term premium and inflation breakevens – propagated by a rising equity market and tighter credit spreads – has often exceeded the negative impact on term premia and nominal bond yields through portfolio balance alone. In risk assets, portfolio balance dominates. In government bond yields, signalling does. The balance between these two factors helps to explain why the link with nominal yields looks less stable.10 But none of these charts looks in the least bit asymmetric.


Putting all this together, it is possible to assemble a set of betas to describe the extent to which different asset classes have proved susceptible to central bank liquidity changes. These are nothing more than rules of thumb – largely visible if you equate moves on the two axes in the charts in this article – but we have nevertheless found them to be relatively stable, and effectively used them out-of-sample for several years now. Those for risk assets are probably more stable than those in govies; while a corresponding beta for nominal Treasury yields can be inferred from the figures for TIPS and breakevens, the lags are not always consistent and its omission is deliberate.11 The higher beta to Fed movements is not supposed to indicate an increased importance for the Fed relative to other central banks – in most cases we prefer to use the global betas, with reserves changes added up dollar-for-dollar – but the Fed has been such an important driver of the global total that we know on many occasions people tend to look at their markets relative to Fed reserves changes alone. There is also an intriguing tendency for assets to become more correlated as they become “hotter” – which we hope to explore in another article. But while we are sure investors will happily run with these numbers in the attempt to work out what liquidity will reprice next, we suspect central bankers and PhD economists will still be puzzling over the theory.
Why look at global reserves?
You may already have noticed that our global charts feature contributions from reserves changes in other jurisdictions, notably China and Switzerland, even though these were not engaged in QE and QT as such. While their contributions are not normally sufficient to change either the analysis or the conclusions with respect to the impact of QT itself, we do think looking at reserves changes globally not only improves the correlation with market moves,12 but once again illuminates with respect to the mechanisms at work. Global reserves are simply the best metric for capturing the quantitative impact of central banks’ monetary operations on the balance between private sector money and the assets available to absorb them.


Ironically this point may be better understood in emerging markets. Many people think the rise in EM FX reserves, and in particular of petrodollar portfolios, has been important for global risk. In some respects the accumulation of FX reserves looks just like QE: it typically leads to a large expansion in central bank assets and liabilities, just comprising foreign assets rather than domestic ones. But with a few significant exceptions, emerging market central banks are typically very careful to “sterilize” their FX reserve accumulation, so as to ensure that commercial bank reserve liabilities at central banks – the sorts of reserves we are concentrating on – are left largely unchanged. In many cases this is achieved through the issuance of bills or other central bank debt certificates designed explicitly to ‘mop up’ liquidity. It can also be achieved if government revenues are deposited at the central bank, rather than being allowed to circulate in markets as reserves do. But it is widely recognized that failure to mop up the excess liquidity created as a by-product of FX reserve accumulation, and an uncontrolled rise in domestic bank reserves, adds to the risk of a credit and asset price boom.
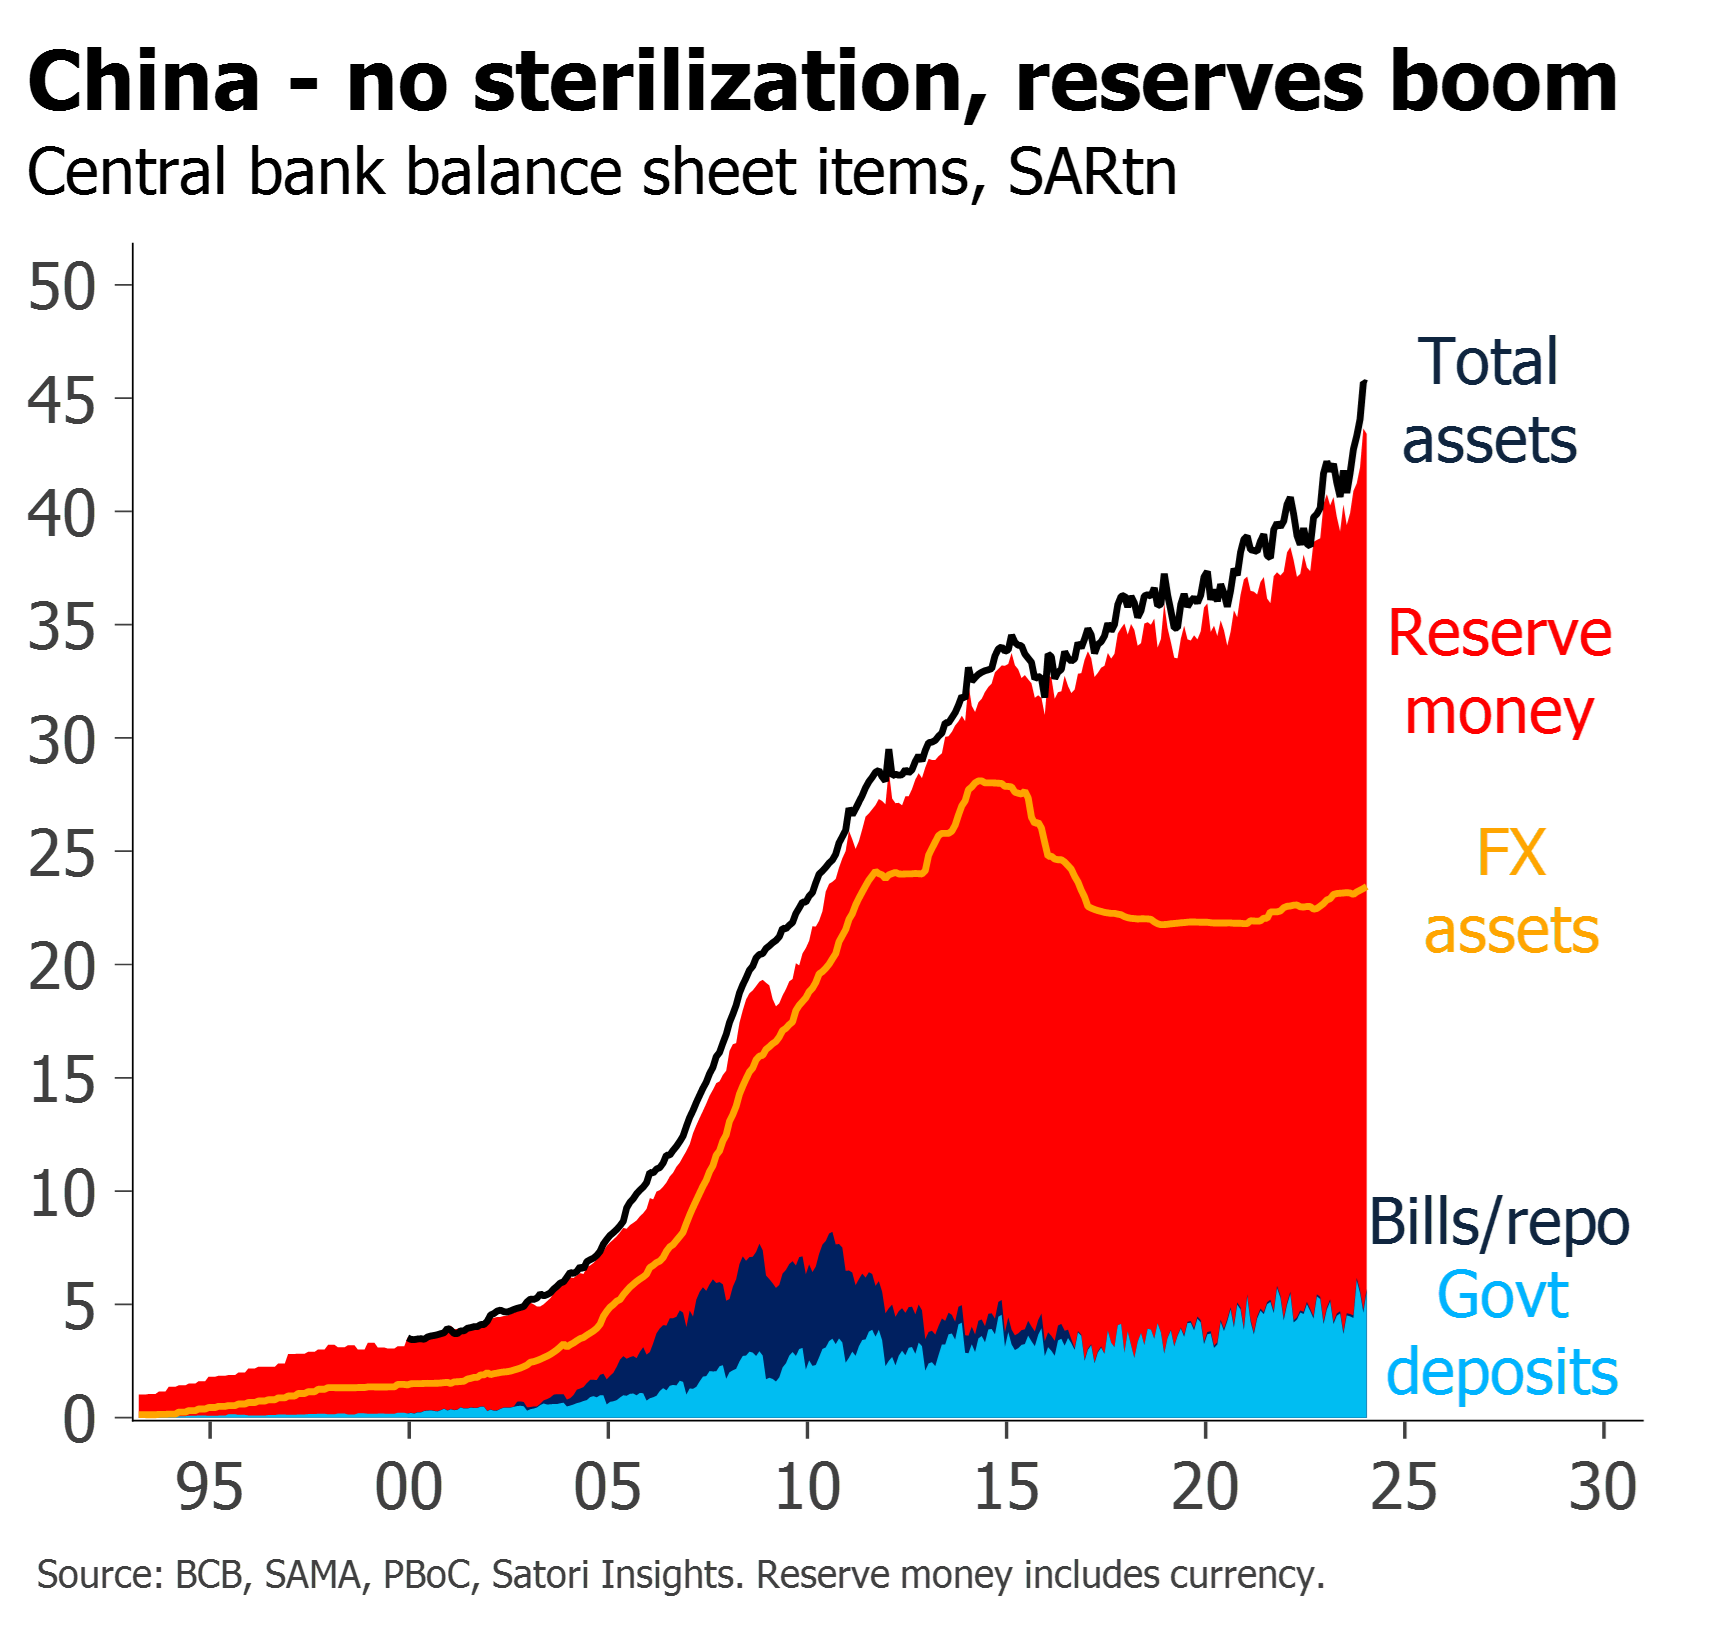
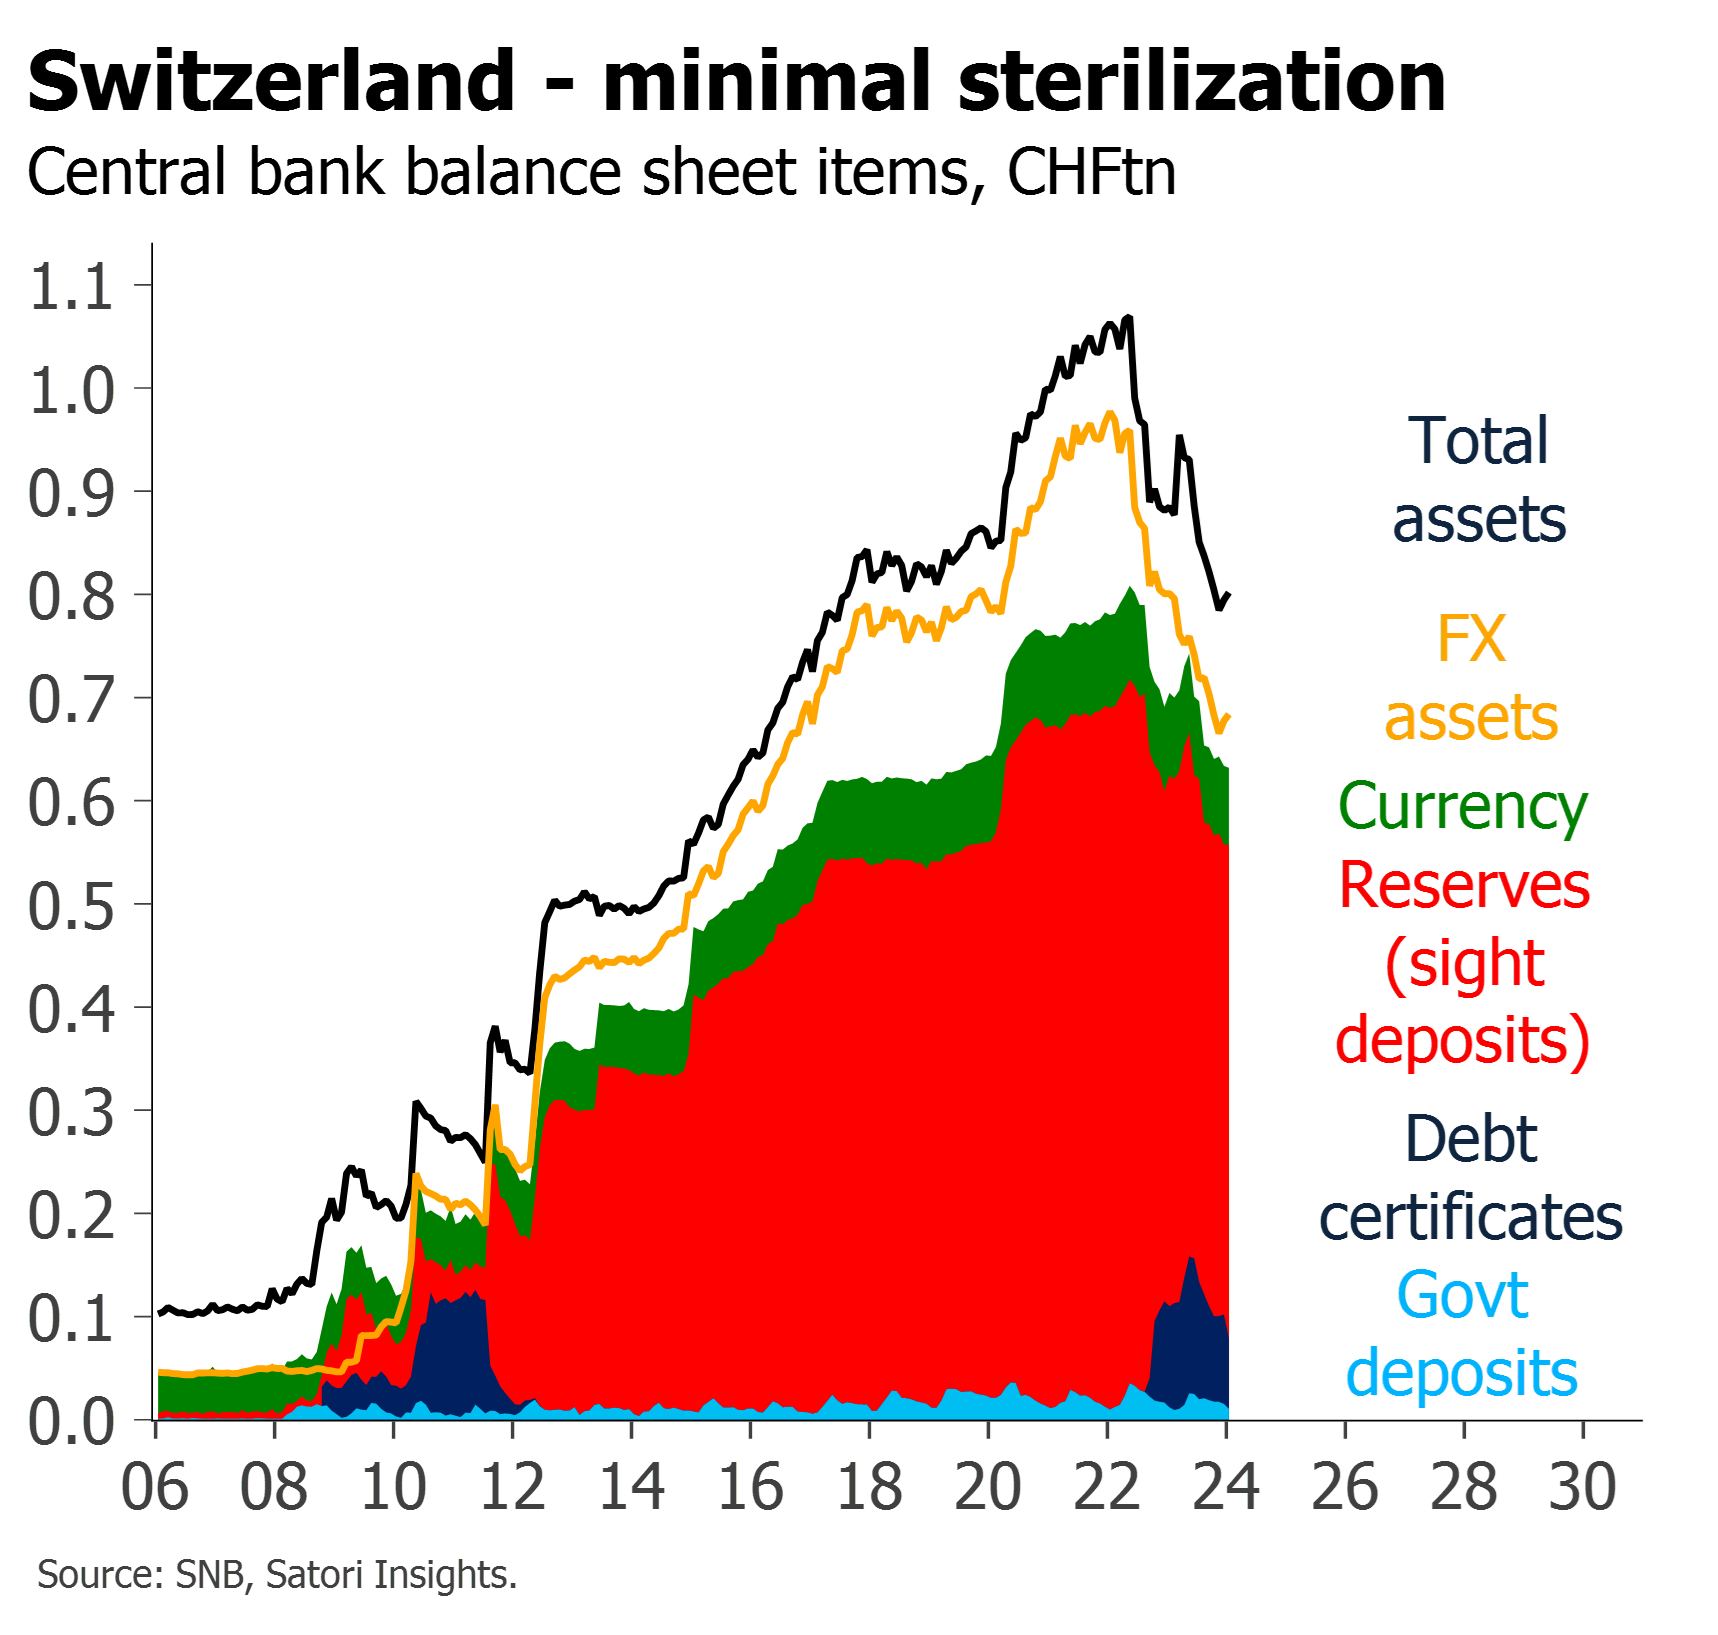
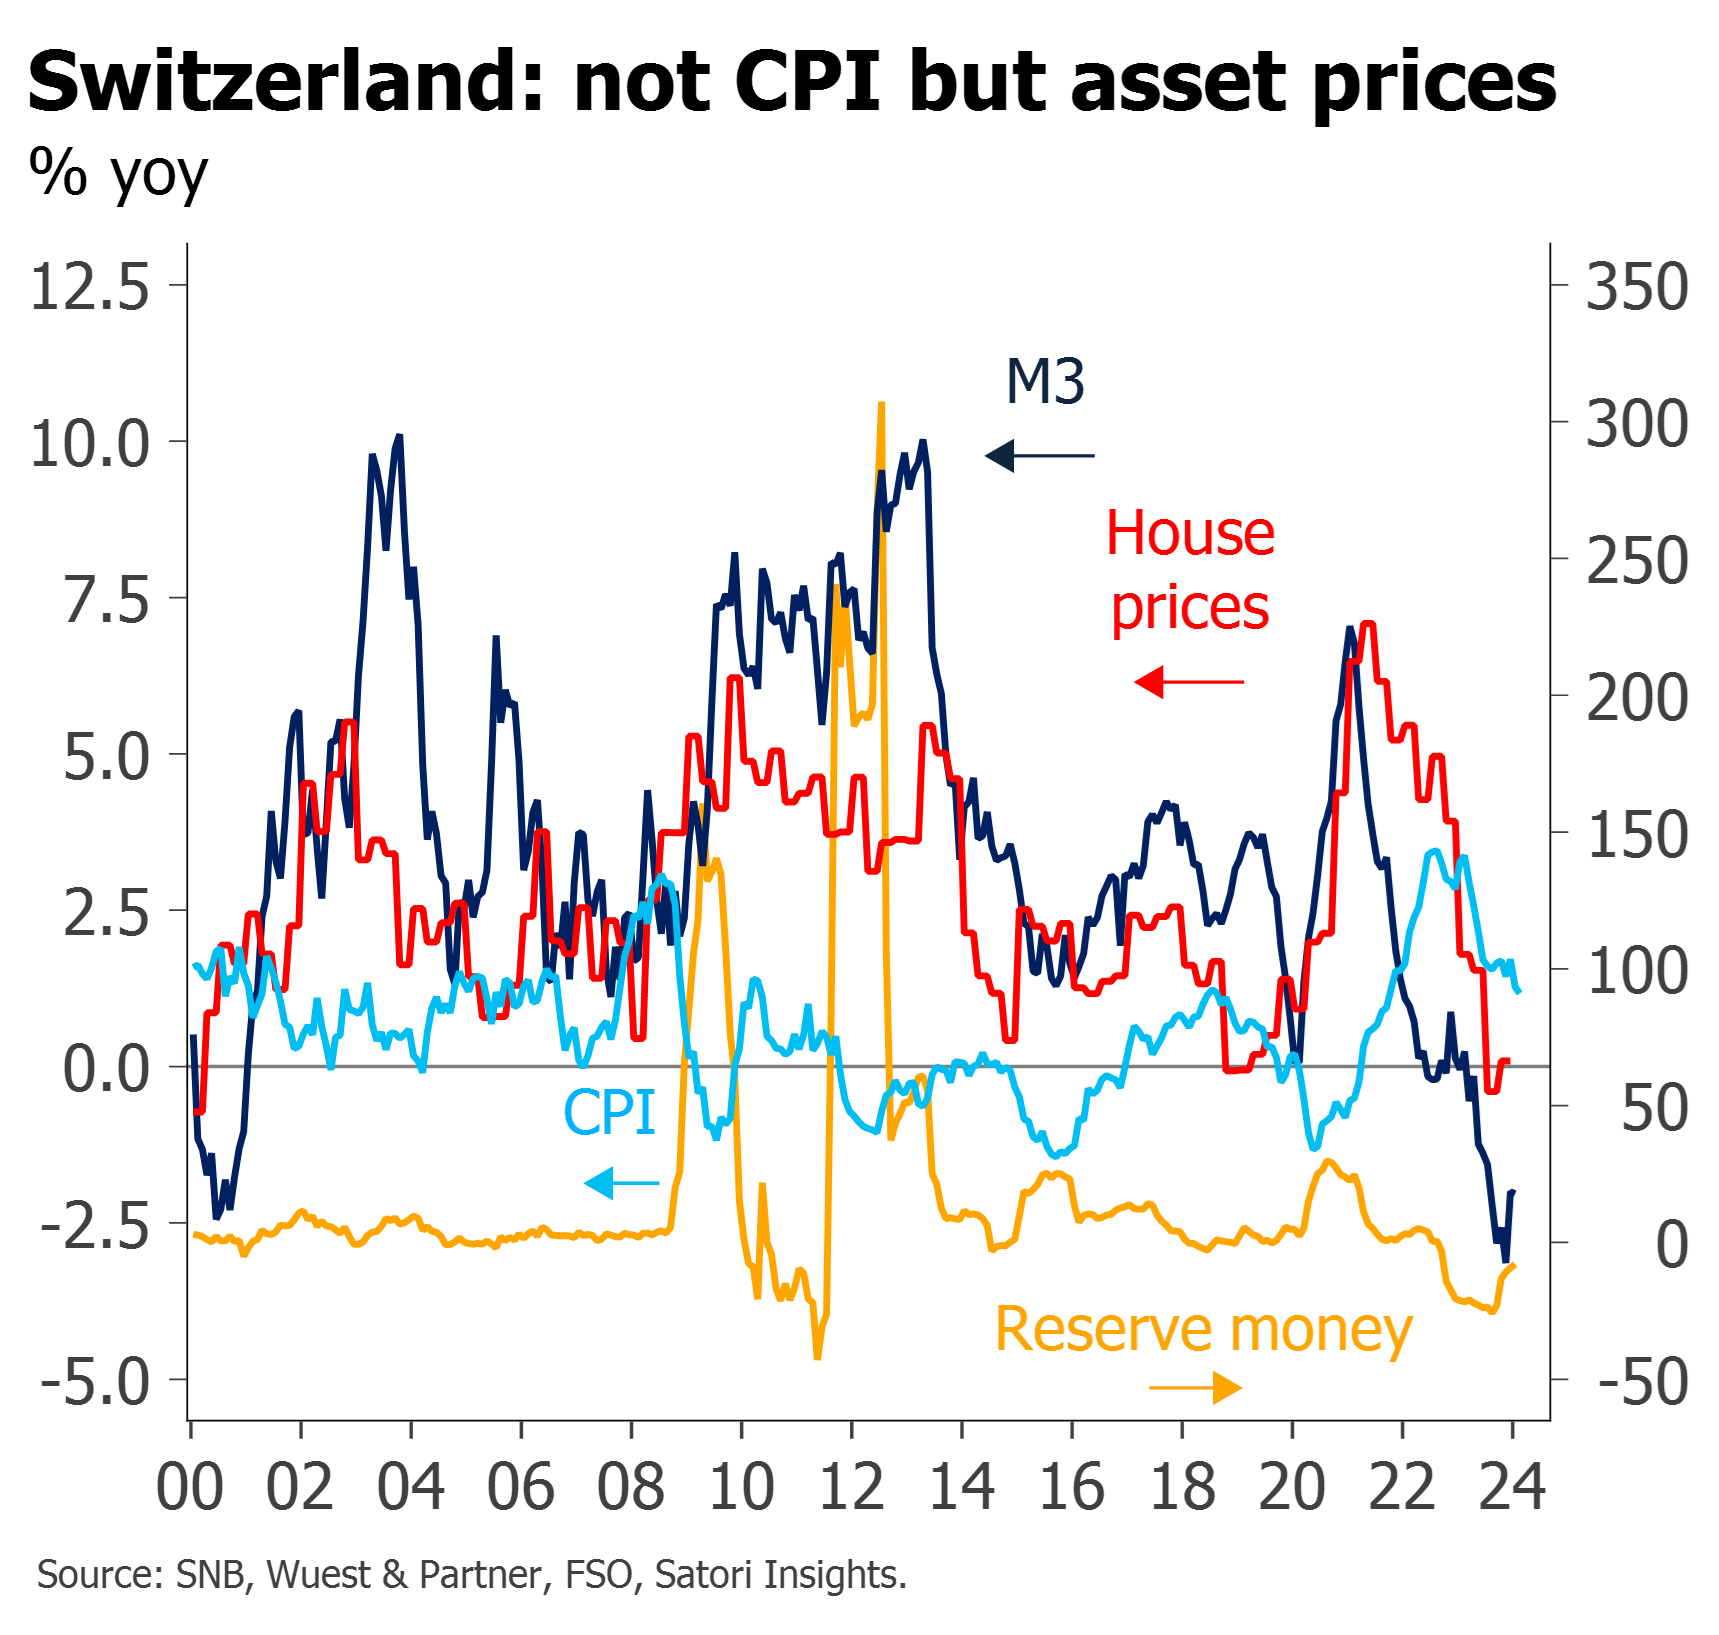
In cases like China, the undesirable effects of such uncontrolled reserve and credit growth are now all too apparent. But even in unlikely places like Switzerland, FX reserve accumulation has mostly been unsterilized. This not only propelled the Swiss central bank to platinum client status at many broker-dealers; a case can also be made that it in driving broader credit growth it has helped take Swiss house prices to ever more stratospheric levels.


Perhaps in a way these rather extreme cases – where central banks become big buyers of foreign securities, rather than their own, and then fail to mop up the associated monetary expansion domestically – help shed light on the mechanism which is at work more broadly under QE and QT. Swiss or Chinese central bank purchases of foreign bonds may on occasion have a demonstrable impact on the prices of foreign fixed income or the assets they are purchasing (the recent apparent correlation between PBOC reserves and US credit spreads is intriguing in this respect). But the major global impact comes not through securities purchases or sales having an impact on bond yields, in turn causing a re-evaluation of theoretical fair values in equity and credit markets. What is more important is the associated quantitative expansion of the domestic reserves base. This quite literally gives the global private sector more money to invest whilst depriving them of assets to invest it in, crowding them from one investment to another – sometimes domestically, sometimes across borders.13
There is nothing asymmetric about the process, nor is it unduly associated with reserves being above or below some magic adequacy level. It is reserves which count, not just the securities purchases themselves. When reserves changes are driven by other factors, they are better off sterilized, otherwise an undesirable feed-through to asset prices results. Emerging market central bankers know this. Why doesn’t the Fed?
Money market messaging
For most of our readers, this may be enough: we usually prefer to focus on trajectories and outlooks rather than bleating on about theory. But we acknowledge that it is still frustrating not to be able to see all the moving parts: to see how a reserves increase trickles out from simply being a central bank liability to something with a broader market impact. After all, theories about reserves being “lent out” have been roundly discredited. Once again, we think Du, Forbes & Luzzetti do great work in assembling data across markets here; once again, we fear they fall just short when it comes to drawing the right conclusions.
The most obvious place to look for a “transition” impact from reserves changes is in money markets. Other authors have previously noted the way in which reserve increases feed through to the basis on cross-currency swaps in particular;14 in the QT study Du, Forbes & Luzzetti not only remark upon the unique role that reserves play15, but also find a link with overnight money-market funding spreads in 6 out of the 7 countries they look at during periods of QT. This is the first time we have seen such a money-market impact demonstrated so comprehensively. Yet despite this, and despite noting the way in which RRP declines have all but eliminated a decline in Fed reserves during QT2, they fail to make the necessary leap to the significance of looking at reserves all along. As close as they come is suggesting that QT doesn’t matter until suddenly perhaps it does.16
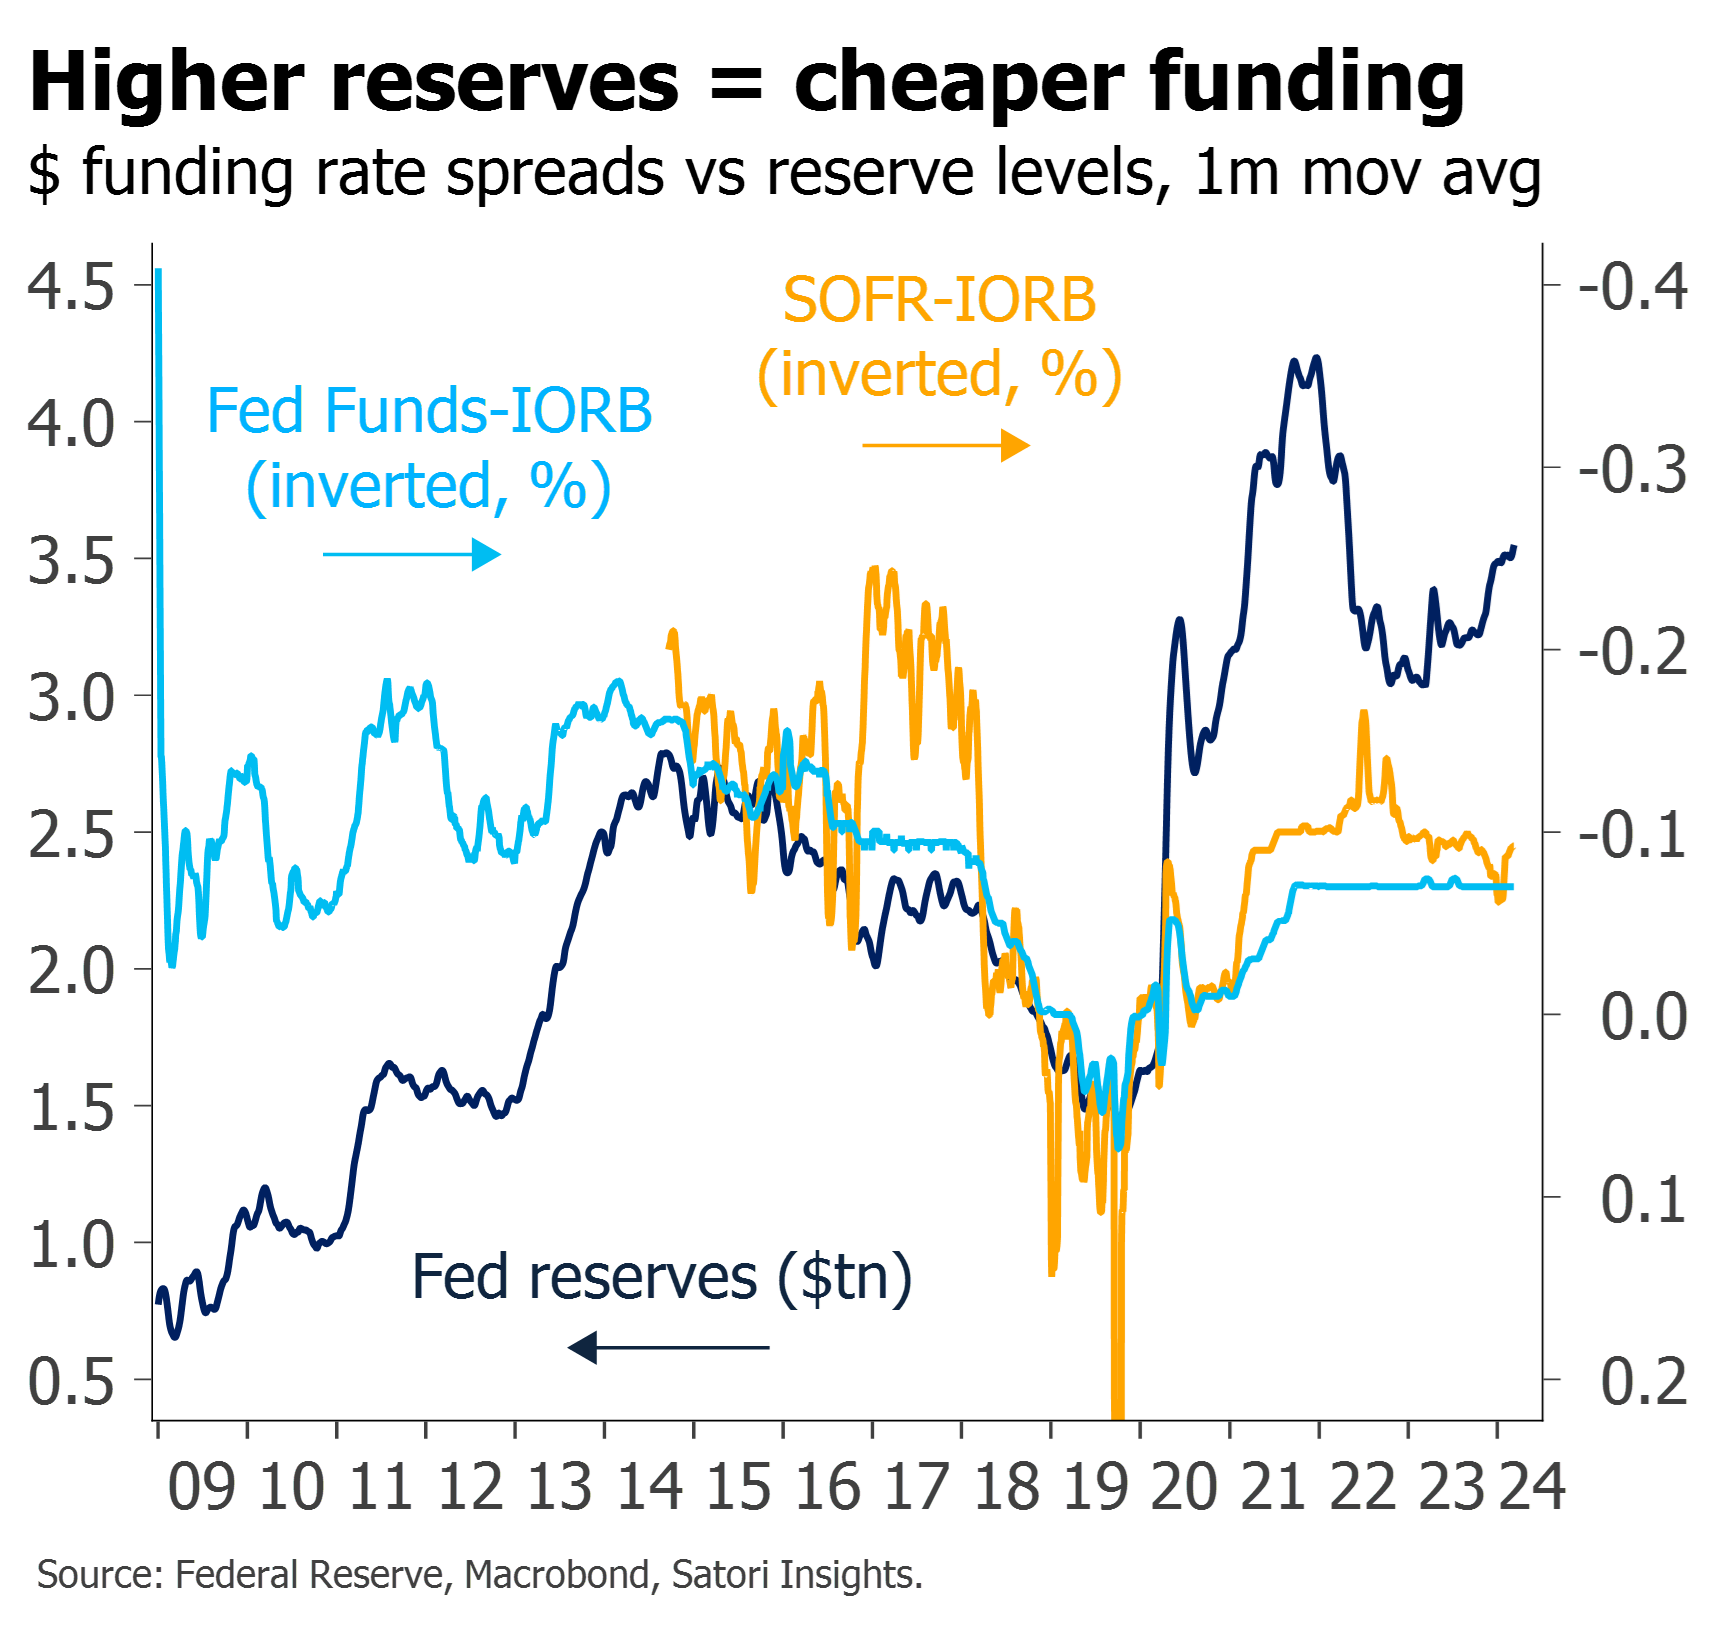

Once again we think the truth is simpler; once again, we think a looser approach helps to demonstrate this. While reserves are not the only factor affecting money market spreads and cross-currency bases, we think there is enough of a relationship to demonstrate their ongoing importance. In the US, it may help to look beyond Fed Funds towards the secured funding markets like SOFR where most interbank lending is concentrated; in the US and elsewhere, an abundance of reserves tends to push money market rates down to the point where non-bank participants are prepared to lend money beneath the rate at which reserves themselves are compensated at the central bank. Relationships are often spiky – for example, spiking over quarter-ends where non-US entities are much less prepared to lend – but we see little to suggest that reserves drainage simply doesn’t matter.
This is clearer still in some of the smaller markets Du, Forbes and Luzzetti look at – but for which they report only summary results.
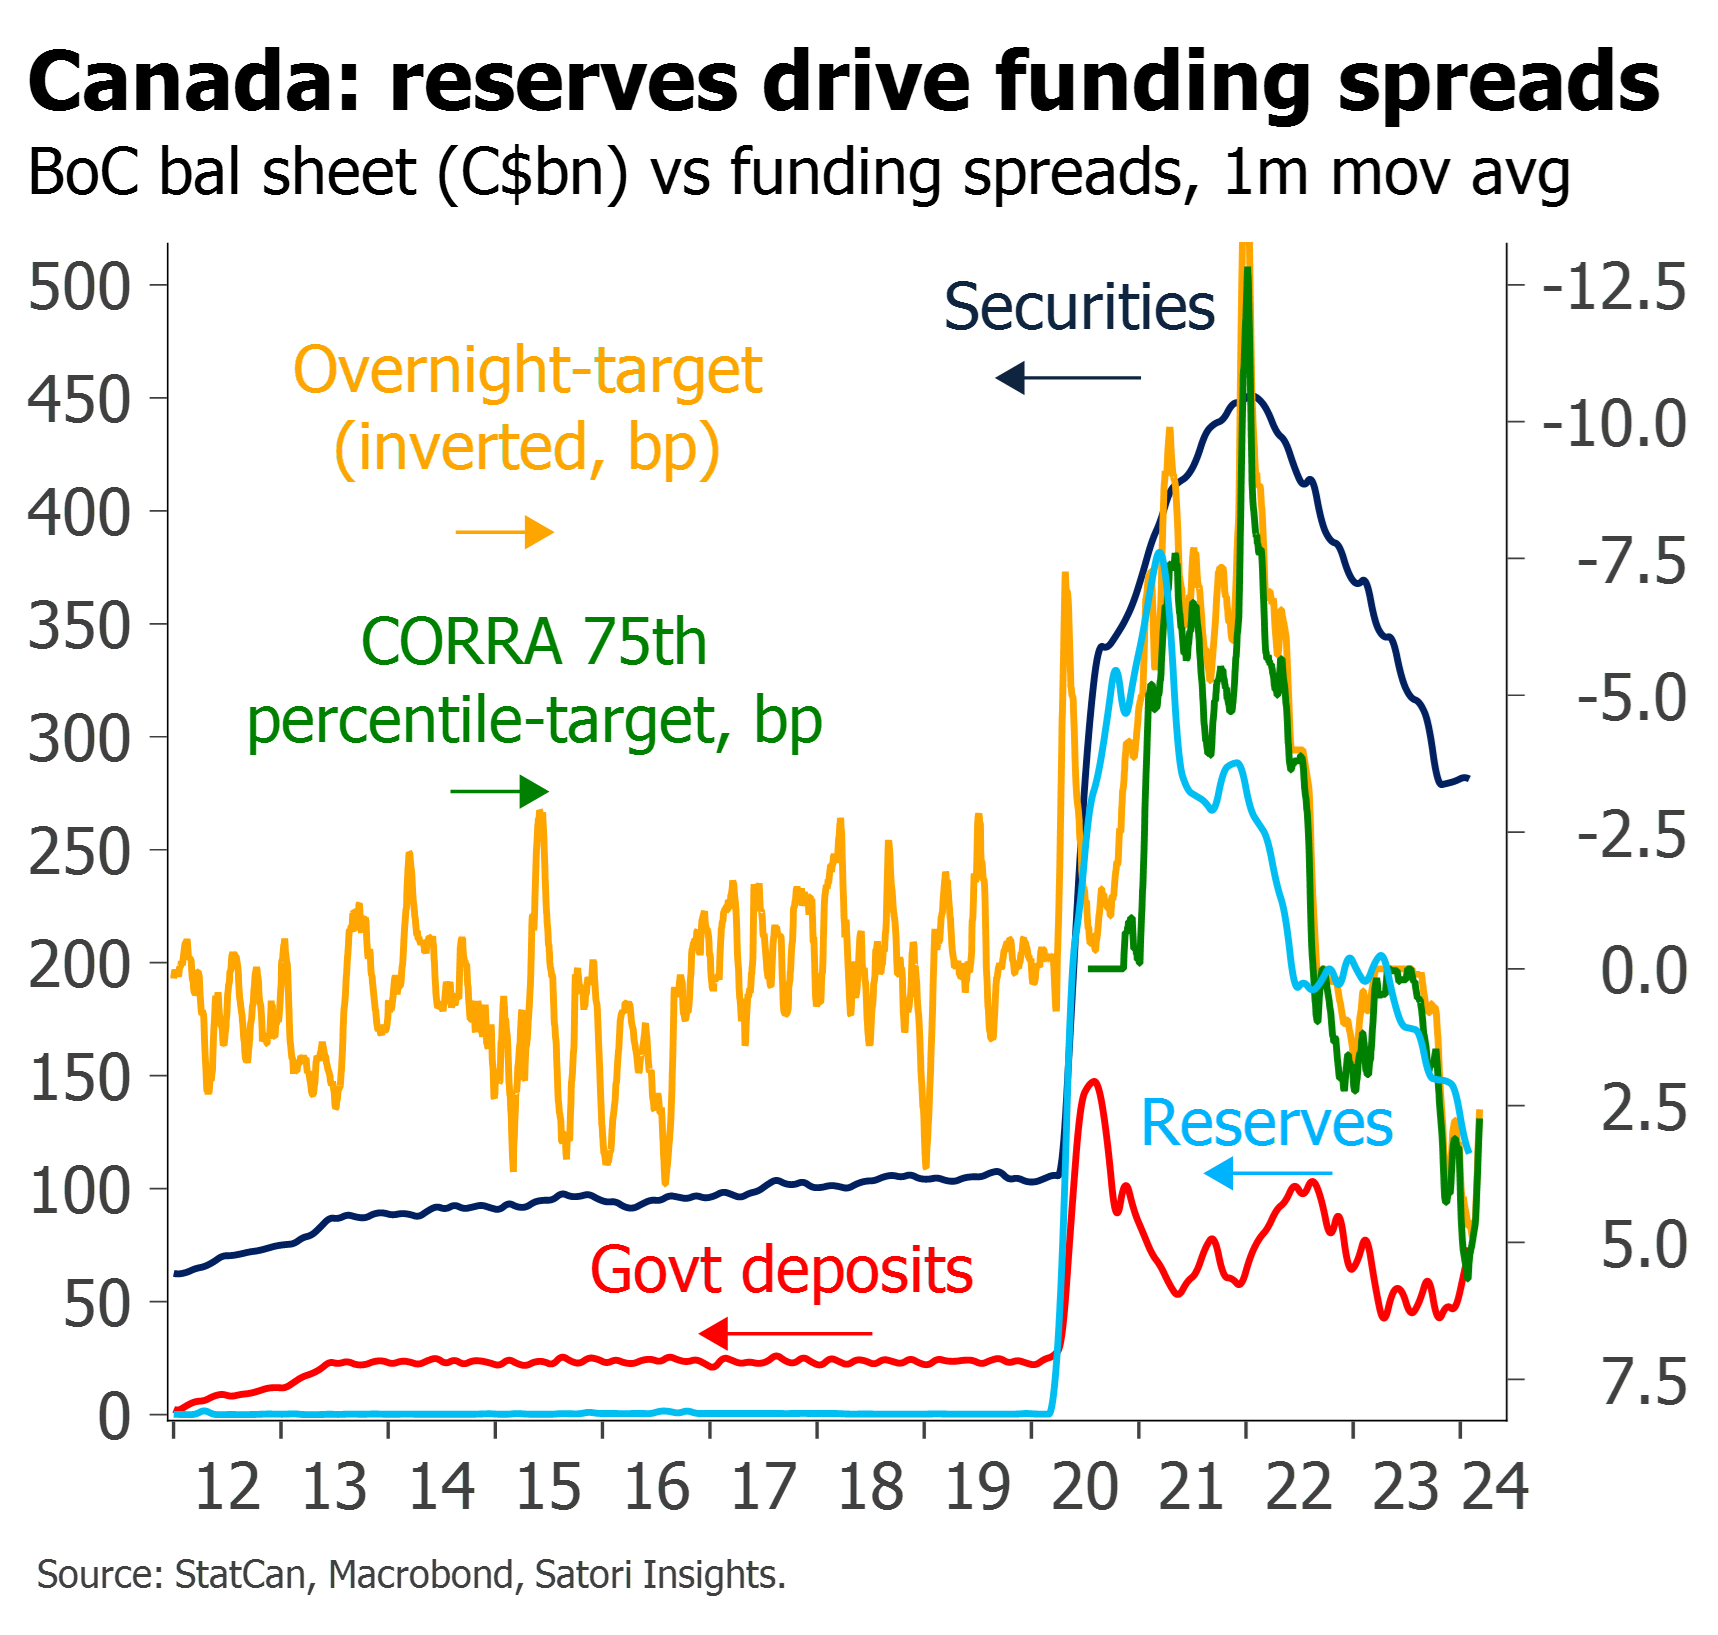
In Canada, for example, money market spreads have clearly been more correlated with reserves changes than with central bank securities holdings. Spreads widened (i.e. overnight rates traded less far through policy rates) in 2021 when reserves fell – even though QE was still ongoing. During QT when securities have been falling, money market spreads have widened more during periods of accelerated reserve decline (due to an increase in government deposits) than when reserves have been relatively stable (as government deposits have been falling).
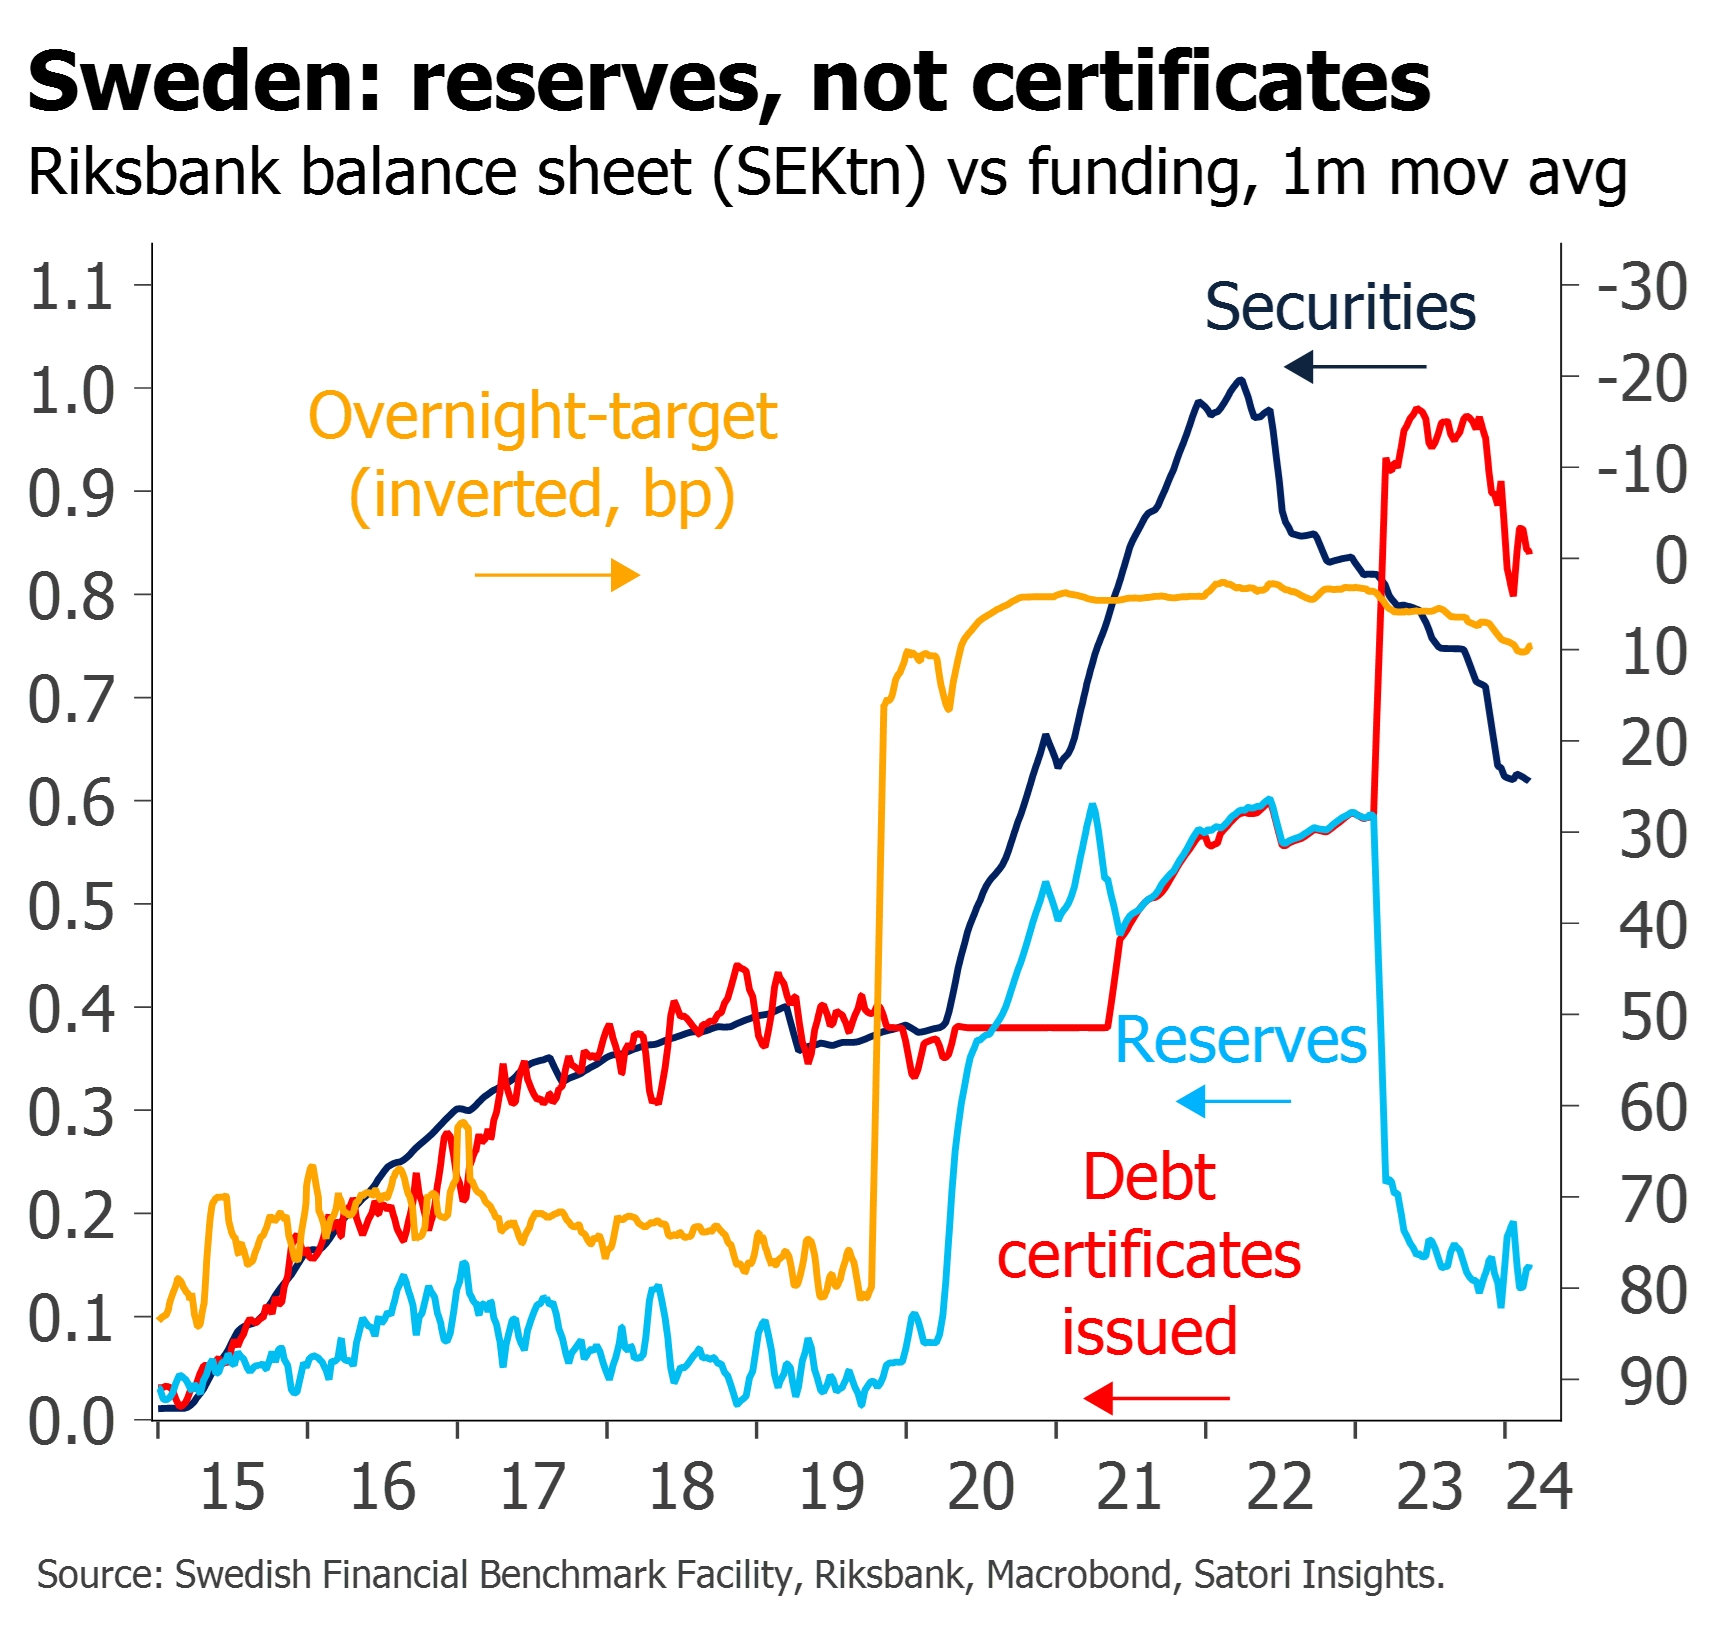
Similarly in Sweden, up until 2020, securities purchases were funded primarily not through securities purchases but through the issuance of sterilizing debt certificates17 – and money market spreads followed moves in reserves. Money market spreads likewise were little changed by the onset of QT in 2022 when securities started falling – but did begin to move when reserves fell in 2023. Step changes complicate the interpretation and the quantitative analysis, but the relationship is plain to see.


In other instances we will freely admit that the mechanisms are less obvious. In Australia, money market spreads seem to have been more closely associated with Covid lockdowns than with reserves or securities changes per se. At the ECB, we have noted empirically for several years a better correlation between risk assets and (securities-government deposits), or perhaps total MFI deposits, than with reserves or securities alone. Some of this ambiguity is reflected also in the link with money market spreads.18
But as previously, we think the way to resolve such doubts is not to increase the quantitative rigour and pin down the analysis to such an extent that the underlying relationships disappear entirely. Rather we prefer to zoom out to a global level, think more loosely about what may be going on, and then to form hypotheses about what may be causing it. At least from a trading perspective, in most cases we think the charts speak for themselves. Central bankers, no doubt, will remain unconvinced.
Enough theory – what about the outlook?
Where all this really matters to most investors is what it implies about the outlook. At first glance, if central banks think QT has little impact, they should be inclined to do more of it, with bearish implications for risk. We think the truth is more complex – and closer to the opposite.
The bearish interpretation has been directly encouraged by some of the central bankers themselves. Lorie Logan’s response to the paper19 raises directly the possibility of continuing QT for longer – and is likely to be influential with other FOMC members given her previous roles.20 She also argues for “only ample reserves and not more than that”, and at least in principle seems to share the aspiration of many central bankers to having the smallest balance sheets possible. The Fed may also be emboldened by the thought that they now have additional tools, such as the Standing Repo Facility, to mitigate against liquidity shortfalls, and have further demonstrated an ability to nip bank runs in the bud through the likes of the BTFP.


But a moment’s consideration of the past twelve months suggests the potential for these aspirations to be undermined. Despite ongoing QT through securities roll-off, the trajectory of reserves at the Fed – and their $600bn increase since early 2023 – has in practice been determined more by the Treasury General Account and especially decline in RRP than by the asset side of the balance sheet. Yes, with “only” $800bn left in RRP there is a limit to how far this can run, and at some point the actions of foreign counterparties rather than US money market funds is likely to become important. And yet already the Fed is talking about slowing the pace of QT, rather than recognizing how little of it they have done in practice.
In the meantime, that leaves plenty of scope for reserves to be boosted still further, as more attractive rates on T-bills and on private repo lending continue to suck money out of RRP. Recall also that while the BTFP ceased making new loans on 11 March and the Fed increased the rate at which they are offered back in January, their term of “up to one year”21, most of it borrowed at rates considerably below current SOFR and money market rates, means that an abrupt repayment and associated reserves drainage remains unlikely.


That means the only real downward impetus to global reserves needs to come from ECB QT (ongoing, but overshadowed by the Fed), the BoJ (unlikely, whether or not they hike rates) or – on our metrics – the PBoC (where if anything there is a growing likelihood of easing).
In sum, both the paper’s authors and Lorie Logan are right to recognize the potential for a step change in the response function of markets once RRP hits a floor and QT finally starts draining reserves. But what they both miss is that when central banks reduce other liabilities – and increase reserves in the process – it actually constitutes a de facto easing. The real asymmetry is not in how markets respond to central banks, but in how central banks respond to markets. As we have already seen, they can be very quick to add liquidity, if necessary through the invention of new facilities like the BTFP, at the first sign of dysfunction in money markets. But for as long as they continue to be wilfully blind to the way in which reserves increases boost the price of risky assets, bubble risk is likely to predominate. That leaves investors with little option but to participate, however irrational the exuberance may seem22 – and central bankers with plenty still to learn.
- Quantitative Tightening Around the Globe: What Have We Learned?, W. Du, K. Forbes, & M. Luzzetti, paper prepared for 2024 US Monetary Forum, Chicago Booth. ↩︎
- Replay: Outlook 2024, M. King, 18 Jan. ↩︎
- “The data is in: how QT impacts markets“, K. Forbes, FT, 4 March. ↩︎
- “Does quantitative easing deserve to come out of the sin bin?” C. Giles, FT, 5 March. ↩︎
- “Discussion of ‘Quantitative Tightening Around the Globe: What Have We Learned?‘”, speech at US Monetary Policy Forum, L. Logan, 1 March. ↩︎
- “The problem with QE is that it works in practice, but it doesn’t work in theory.” FT, Oct 2014. ↩︎
- We would be amazed if any investors in credit share the view that a two-day window following QE announcements “provides investors [sufficient] time to absorb and incorporate the news”? But even in equities, our charts strongly suggest the opposite: while there may on occasion be announcement effects, in general it is only as QE and QT flows actually hit markets – sometimes even with a short delay – that we see prices adjust. ↩︎
- The main exception is the ECB, where empirically we find securities-government bond holdings works better. We have yet to come up with a fully satisfying explanation as to why this is the case – though it does seem plausible that reserves and deposits created through LTROs do not circulate, or have the same potency, as reserves created through QE, not least because of different regulatory treatment under LCR. ↩︎
- Again tantalizingly, they hint at this twice. They come closest in asking the question “Does QT have effects outside a country’s borders?” – but then focus only on announcements. They also acknowledge that “The aggregate reduction in global central bank balance sheets is driven by the reduction in the largest economies – particularly the US and Euro area – even if the relative pace of QT in these large economies is somewhat slower.” But they fail to look at an aggregate reserves metric, and then at the implementation-related link with markets. ↩︎
- This also helps to explain the wide variation in academic estimates of the move in bond yields associated with different bouts of QE and QT. ↩︎
- We likewise show 2y TIPS in the charts because the relationship is stronger, but have included 10y TIPS betas in the table – even if they are slightly less reliable – as they are so much more widely followed. ↩︎
- In China we think the best overall fit is with monthly reserves numbers, but sometimes also use the high-frequency metrics like monetary operations as proxies. It is a bit less obvious on the weekly data that including these improves the overall correlation. ↩︎
- We plan to write more about these cross-border effects in another piece. ↩︎
- Sterilization and the fracking of reserves, Z. Pozsar, Sep17. ↩︎
- “Reserves play a pivotal role in facilitating intraday payments and money market intermediation… No other safe asset, such as Treasury securities, repo or foreign exchange swap lending, are perfect substitutes for holding reserves.” ↩︎
- “Although QT has been smooth to date, frictions could increase in the future so that QT quickly evolves [from being like ‘paint drying’] into more like watching ‘water boil'”. ↩︎
- It is unclear to us why the Riksbank chose to sterilize so much of the impact in this fashion – but their description of the certificates as “draining liquidity” suggests they were fully aware of it. ↩︎
- What originally puzzled us at the ECB was the way in which the advent of the LTROs during the sovereign debt crisis seemed to have a positive effect on risk pricing, but the withdrawal of liquidity when the rolled off failed to have a negative one. This may simply be through the power of Draghi’s famous “whatever it takes”; it may also conceivably reflect differences in the LCR treatment of reserves created through repo relative to reserves created through QE. ↩︎
- “Discussion of ‘Quantitative Tightening Around the Globe: What Have We Learned?‘”, speech at US Monetary Policy Forum, L. Logan, 1 March. ↩︎
- She was previously manager of SOMA for the FOMC and (more or less) head of markets for the NY Fed. ↩︎
- Bank Term Funding Program Terms and Conditions, Federal Reserve, Jan24. ↩︎
- “Credit Markets Are Acting Like Easy Money Era Never Ended“, Bloomberg, 8 Mar. ↩︎