
To paraphrase HL Mencken, for every aspect of QE’s impact on markets there is a theory that is clear, simple and wrong. This applies especially when it comes to the impact of QE and QT on bond yields.
As fixed income investors struggle to come to terms with the magnitude of the past two years’ backup in bond yields, it feels intuitive that QT should bear a significant chunk of the responsibility. As Mohamed El-Erian put it with respect to the US, “The Fed, which was the most reliable buyer for over a decade with a seemingly limitless printing press and little sensitivity, is now [net] selling bonds, reversing its quantitative easing programmes since the financial crisis with quantitative tightening.”1 Besides, haven’t any number of studies from the central banks themselves pointed in the same direction?2
But it is notable that the majority of the central bank studies are “event” studies, focused almost exclusively on the impact the announcement of QE and QT programmes had on markets over the following day or at most week. Many market participants would argue the impact of such massive purchase – and now net selling – programmes has taken much longer to be discounted, whatever economic theory might have to say on the matter.
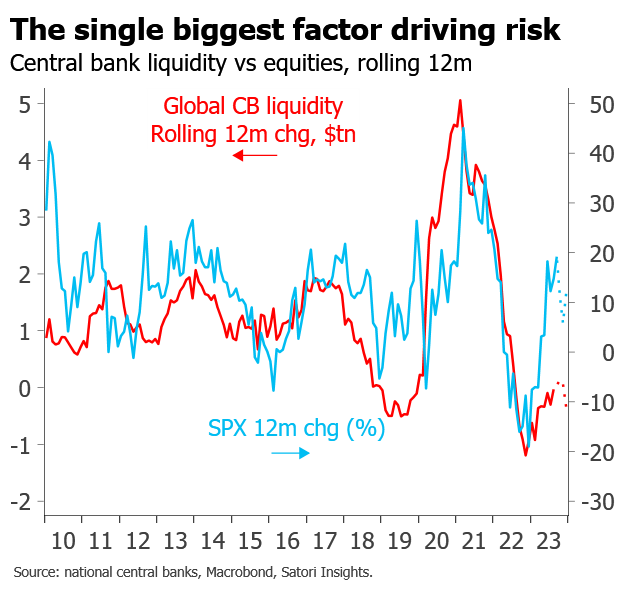
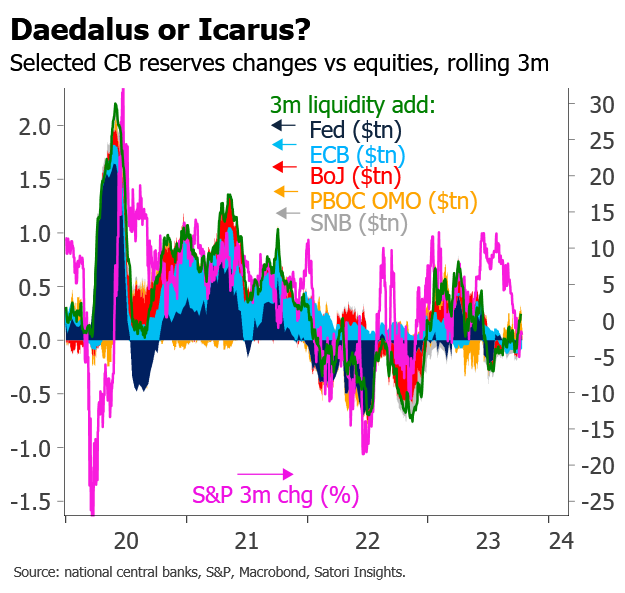
The sorts of simple but powerful correlations we tend to favour point to a more nuanced impact. For risk assets like equities and credit things are clear enough: QE drives up risk assets and QT causes them to fall – at least once we measure them properly, using primarily reserves rather than just securities and being careful to remove any FX effects. A useful rule of thumb which emerges here – and which we believe still applies – is that $1tn in QE/QT is worth around 10% on or off global equities (the MSCI or S&P, say3), around 50bp off or on investment-grade credit spreads, and around 350bp off or on high-yield credit spreads. While the precise lag is slightly variable, our charts strongly suggest markets have struggled to price in these effects on the announcement dates and have reacted only as net purchases or sales have taken place.4
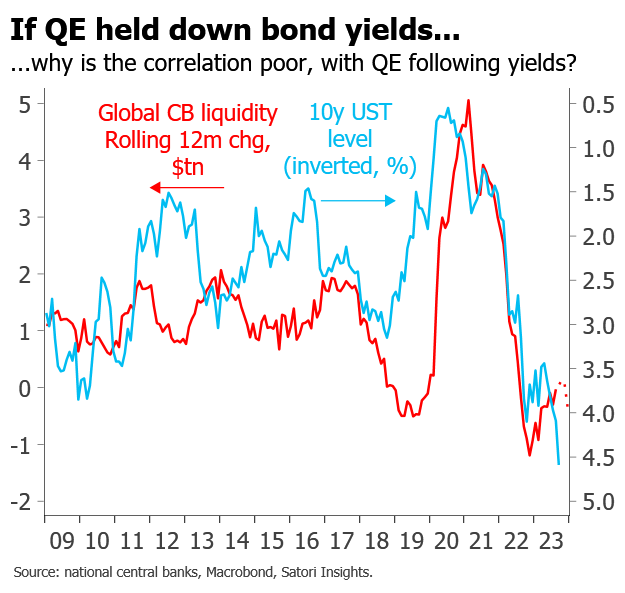
But with bond yields the impact is a bit more subtle. Simply plotting the same global QE series – which works so well for risk assets – against nominal bond yield levels, or even changes, leads to a much more confusing pattern. Yes, the recent bout of QT has coincided with a large backup in bond yields. But in general it looks more as though the QE and QT have followed yield moves rather than caused them, and frankly the overall correlation is poor. Given that the vast majority of central bank purchases and sales are concentrated on fixed income markets, this seems odd.
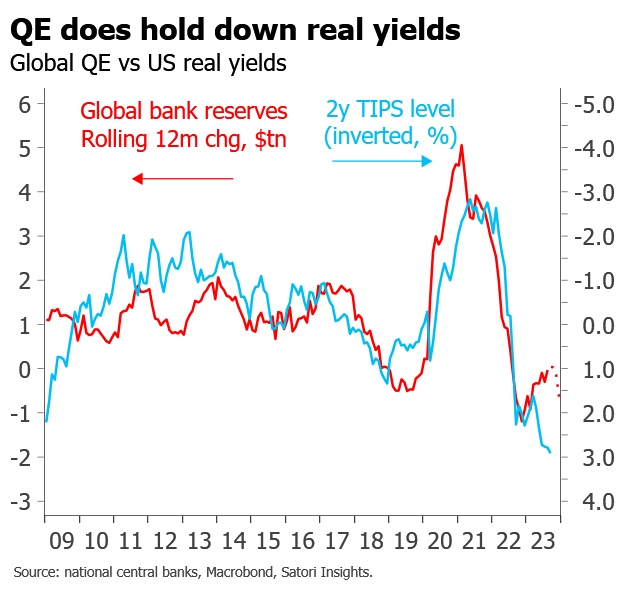
Fortunately it is not too difficult to make sense of – and even reconcile with economic theory – once we break bond yields down into their components. QE does hold down real yields, in conjunction with policy rates themselves, and QT and tightening have allowed them to rise. This impact seems to occur more or less in real time, as with the impact on risk assets, and presumably takes place through a portfolio balance channel. But its effect on nominal yields is obscured by what is effectively the opposite effect on inflation breakevens.
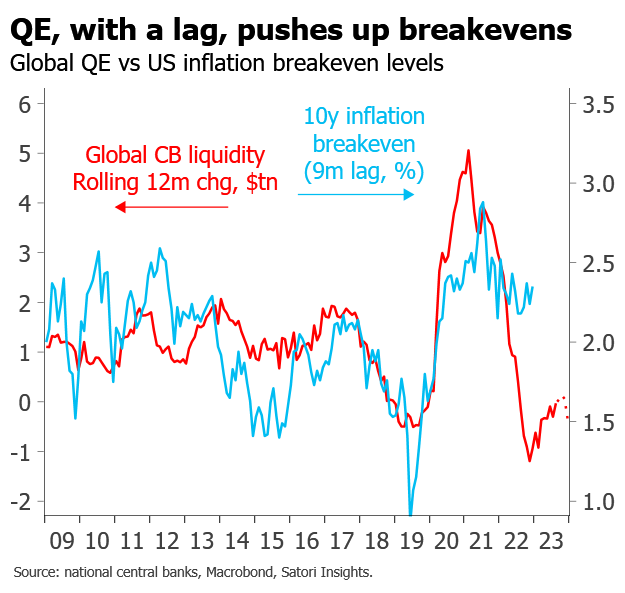
QE has historically tended to push up inflation breakevens, presumably through a signalling channel, with around a 9-month lag. We suspect that some of this effect occurs in response to the move in asset prices: when equities move higher during bouts of QE, it adds to the feeling that the economy is likely to recover and take inflation with it. Conversely, during periods of reduced QE, balance sheet reduction or QT, with a similar lag, inflation breakevens have tended to fall.
How is this time different?
All this feels reasonably intuitive. But both the magnitude of the recent yield moves, and what appear to be potential breakdowns in the relationships shown in recent data, beg the question of whether this time is different when it comes to QT, if so, how, and what we can therefore expect for yields as a result.
The first thing that seems to be happening is that both real yields, especially in longer maturities, and term premium, have moved higher during this episode of QT than previously. Some of the move in real yields will simply be policy rates having moved off the lower bound having been stuck there for the previous decade. But the larger move in the long end, and the move up in term premium, suggest a different driver.


The historical link between term premium and QE has again been counterintuitive. Many would say that QE holds down term premium, and QT should allow it to rise. But a quick glance at the charts demonstrates that the empirical pattern is very different. Historically term premium has tended to rise during periods of QE, and then, sometimes with a lag of up to a year in 2019, to fall during periods of balance sheet reduction or QT. This applies whether we use US or global QE, and regardless of whether we use the New York Fed’s widely followed Adrian-Crump-Moench model or less-well-known alternatives.
While the extent of the historical lags means it may be slightly early to tell, we think two things are potentially going on here. First, asset prices are thus far behaving “better” than might be expected historically. Second, the prospect of ongoing large fiscal deficits may be causing a breakdown relative to history. Let us consider each in turn.
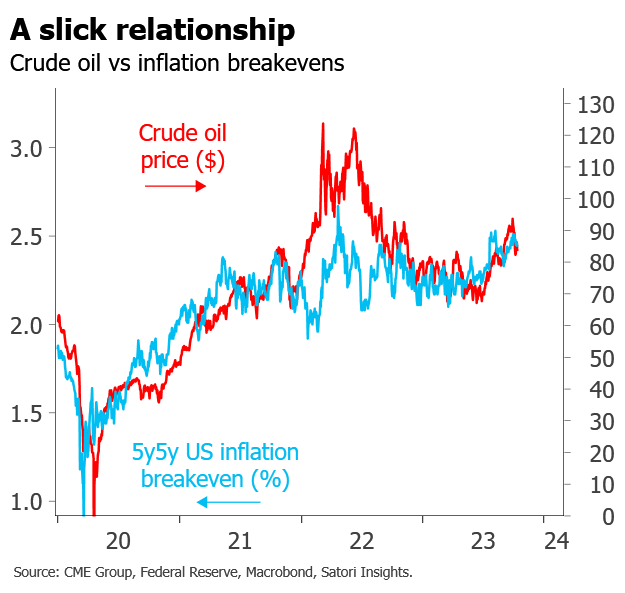
We suspect the “outperformance” of risk assets is directly responsible for the stickiness of inflation breakevens. While wars in Ukraine and now Israel, and supply chain disruption and reorientation, will undoubtedly have played a role, and indeed inflation breakevens remain very much in line with developments in oil prices, the main factor which has accompanied previous reductions in QE and proved missing this year is a serious correction in asset prices.
While many might be tempted to attribute this to a “reversion to fundamentals”, a move up in r-star, or a return to private sector credit creation, we think this would be a mistake. First, on some timescales and subsets of the data the dislocation relative to central bank liquidity is barely even visible, and seems in danger of coming back to earth. Second, while the surge in money growth associated with the surge in fiscal spending, especially in the US, presumably played a large part, the asset price move seems out of line even once this is taken into account.


A more concerning and potentially durable reason for the move up in bond yields and term premium is fiscal deficits. We still consider ourselves less alarmed on this front than many: as we see it it is likely to have been the disinflationary effects of scalable technology, and a diminishing private sector desire to borrow in the face of ever lower rates, rather than fiscal rectitude per se, which led to term premia falling. But at an absolute minimum, it is troubling to contemplate just how far term premium has fallen, and the scope for it to rise again in the face of persistent deficits, higher interest costs and UK-style bond tantrums. If you want to find the bogeyman behind higher bond yields, look to the prior monetary and fiscal stimulus, not the QT.

- “US bond market is losing its strategic footing”, M. El-Erian, FT, 17 Oct. ↩︎
- See, for example, “The Effects of Quantitative Easing on Interest Rates: Channels and Implications for Policy”, A. Krishnamurthy & A. Vissing-Jorgensen, Brookings. ↩︎
- The beta with the NASDAQ is around 50% higher than this. ↩︎
- We suspect this is because the scale of QE and QT has tended, especially over short timescales, to dwarf other, private sector, credit creation. ↩︎