The #1 rule about outlooks

- The biggest surprise of 2023 was not the resilience of the US consumer
- It was that central banks added nearly $1tn in liquidity, rather than removing $1tn as had been widely expected.
- This swing alone is worth 20% on equities – almost exactly the YTD gain in the S&P.
- We think 2024 will show central banks have overtightened rates whilst simultaneously overstimulating risk assets.
- But we also fear their misunderstanding of the dynamics means they may yet do more of both.
Central bank liquidity update

- Poor risk asset performance in Sep/Oct reduces gap to CB liquidity
- Fed $300bn reserve increase over past eight weeks helps explain renewed rally in S&P
- Conversely, despite talk of stimulus, China liquidity injections remain lacklustre
- Liquidity outlook still driven by RRP – and is much less negative than might be expected
The mind-bending maths of fiscal financing

- Persistent fiscal deficits are increasingly cited as the #1 reason to short bonds
- But the historical record is remarkably and perplexingly clear
- High debt levels, and even high fiscal deficits, have historically been associated with bond yields falling, not rising
- Only in part does this reflect factors like financial repression
- It is also due to the counterintuitive nature of the credit creation process itself
Don’t blame QT for the bond backup (free to view)
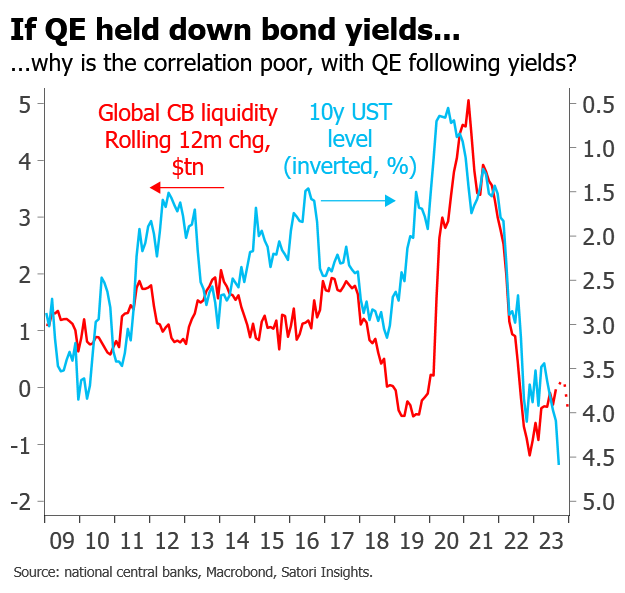
- It is often said that QE held down bond yields, meaning QT should be a major contributor to this year’s rise
- But the evidence for this is deeply questionable
- QE does indeed hold down real yields, through a portfolio balance effect
- But it also pushes up inflation breakevens via signalling
- What is missing so far from this round of QT is the historical fall in breakevens
- The true driver of higher bond yields lies with inflation, not QT
Central bank liquidity update
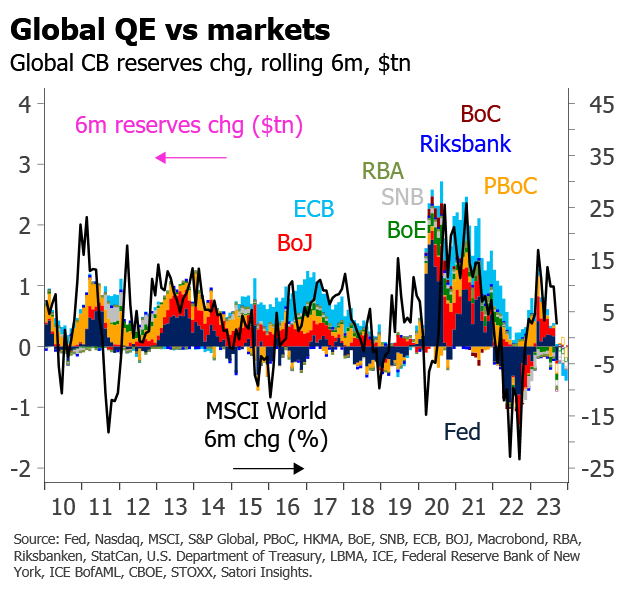
- CB liquidity still a better explanation of risk asset performance than many fundamentals
- H1 liquidity injections now fading
- Market performance – despite some prior ‘excess’ – largely fading in line
- Prospects mostly negative but depend on RRP, BoJ and explanation for the prior ‘excess’
Distributional accounts
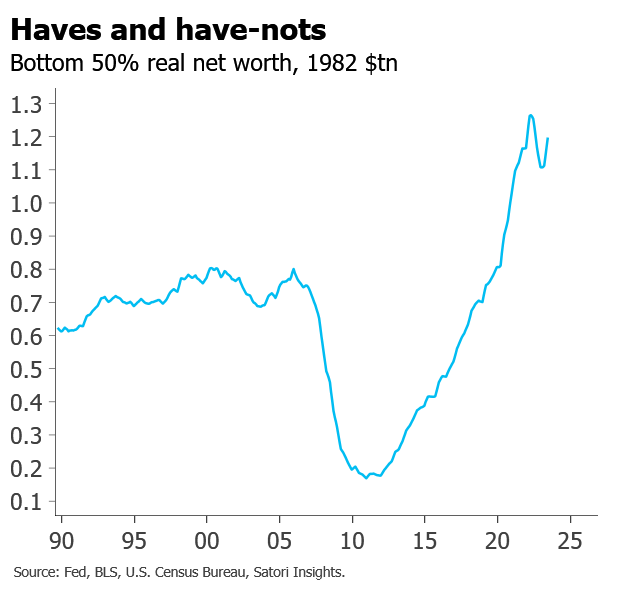
This is a test of various chart sizes. Deposits – especially in real terms – have been falling sharply, and those for the bottom quintiles are now back to pre-Covid levels. This is now 900×700, the full size original: Nevertheless, what’s striking to me is how much they’ve risen in general – especially during the […]
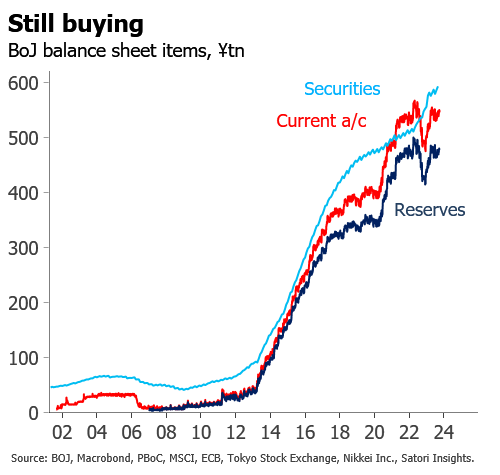
BoJ is only central bank still buying
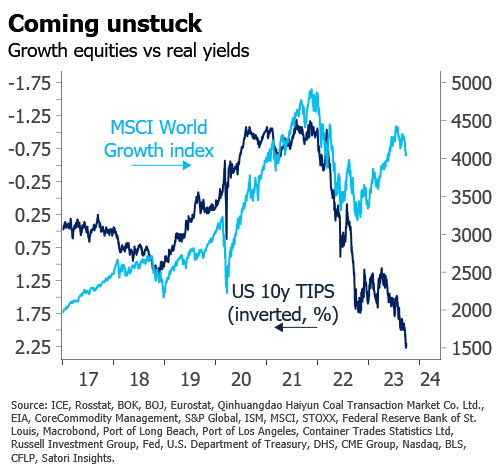
Real yields decoupling
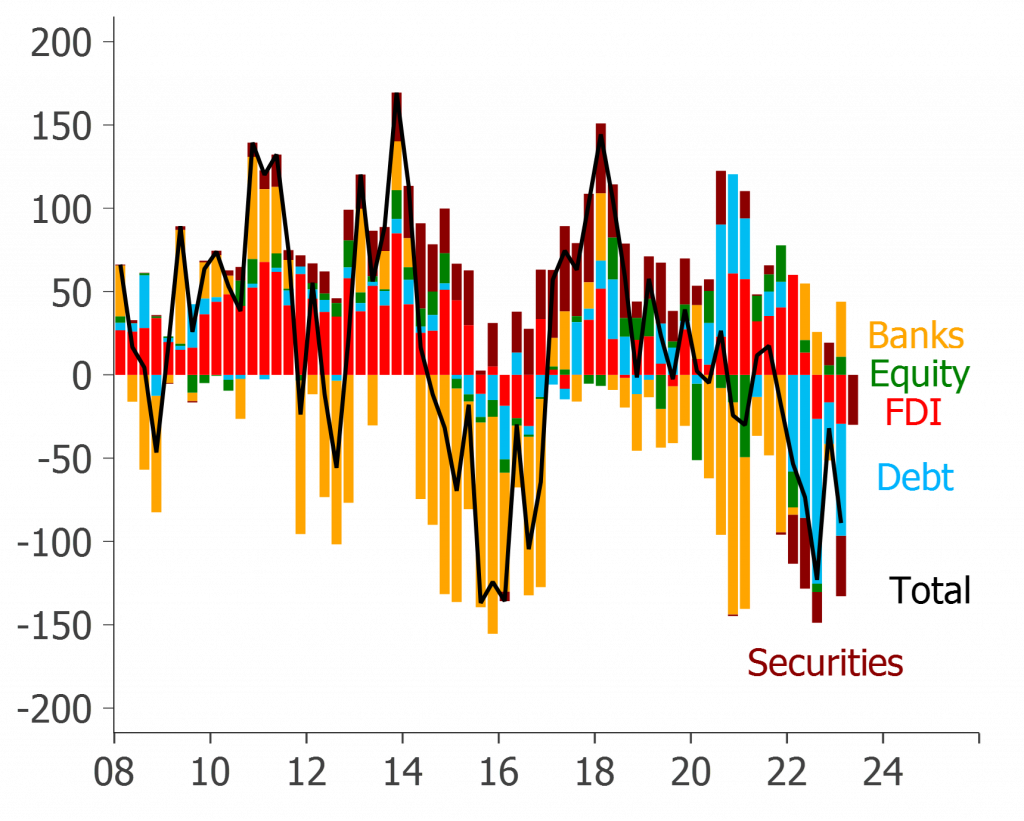
Capital flight from China
BoJ is only central bank still buying