Skip to content
The violent rotation in equities is sparking hopes of a fundamentally-driven rally
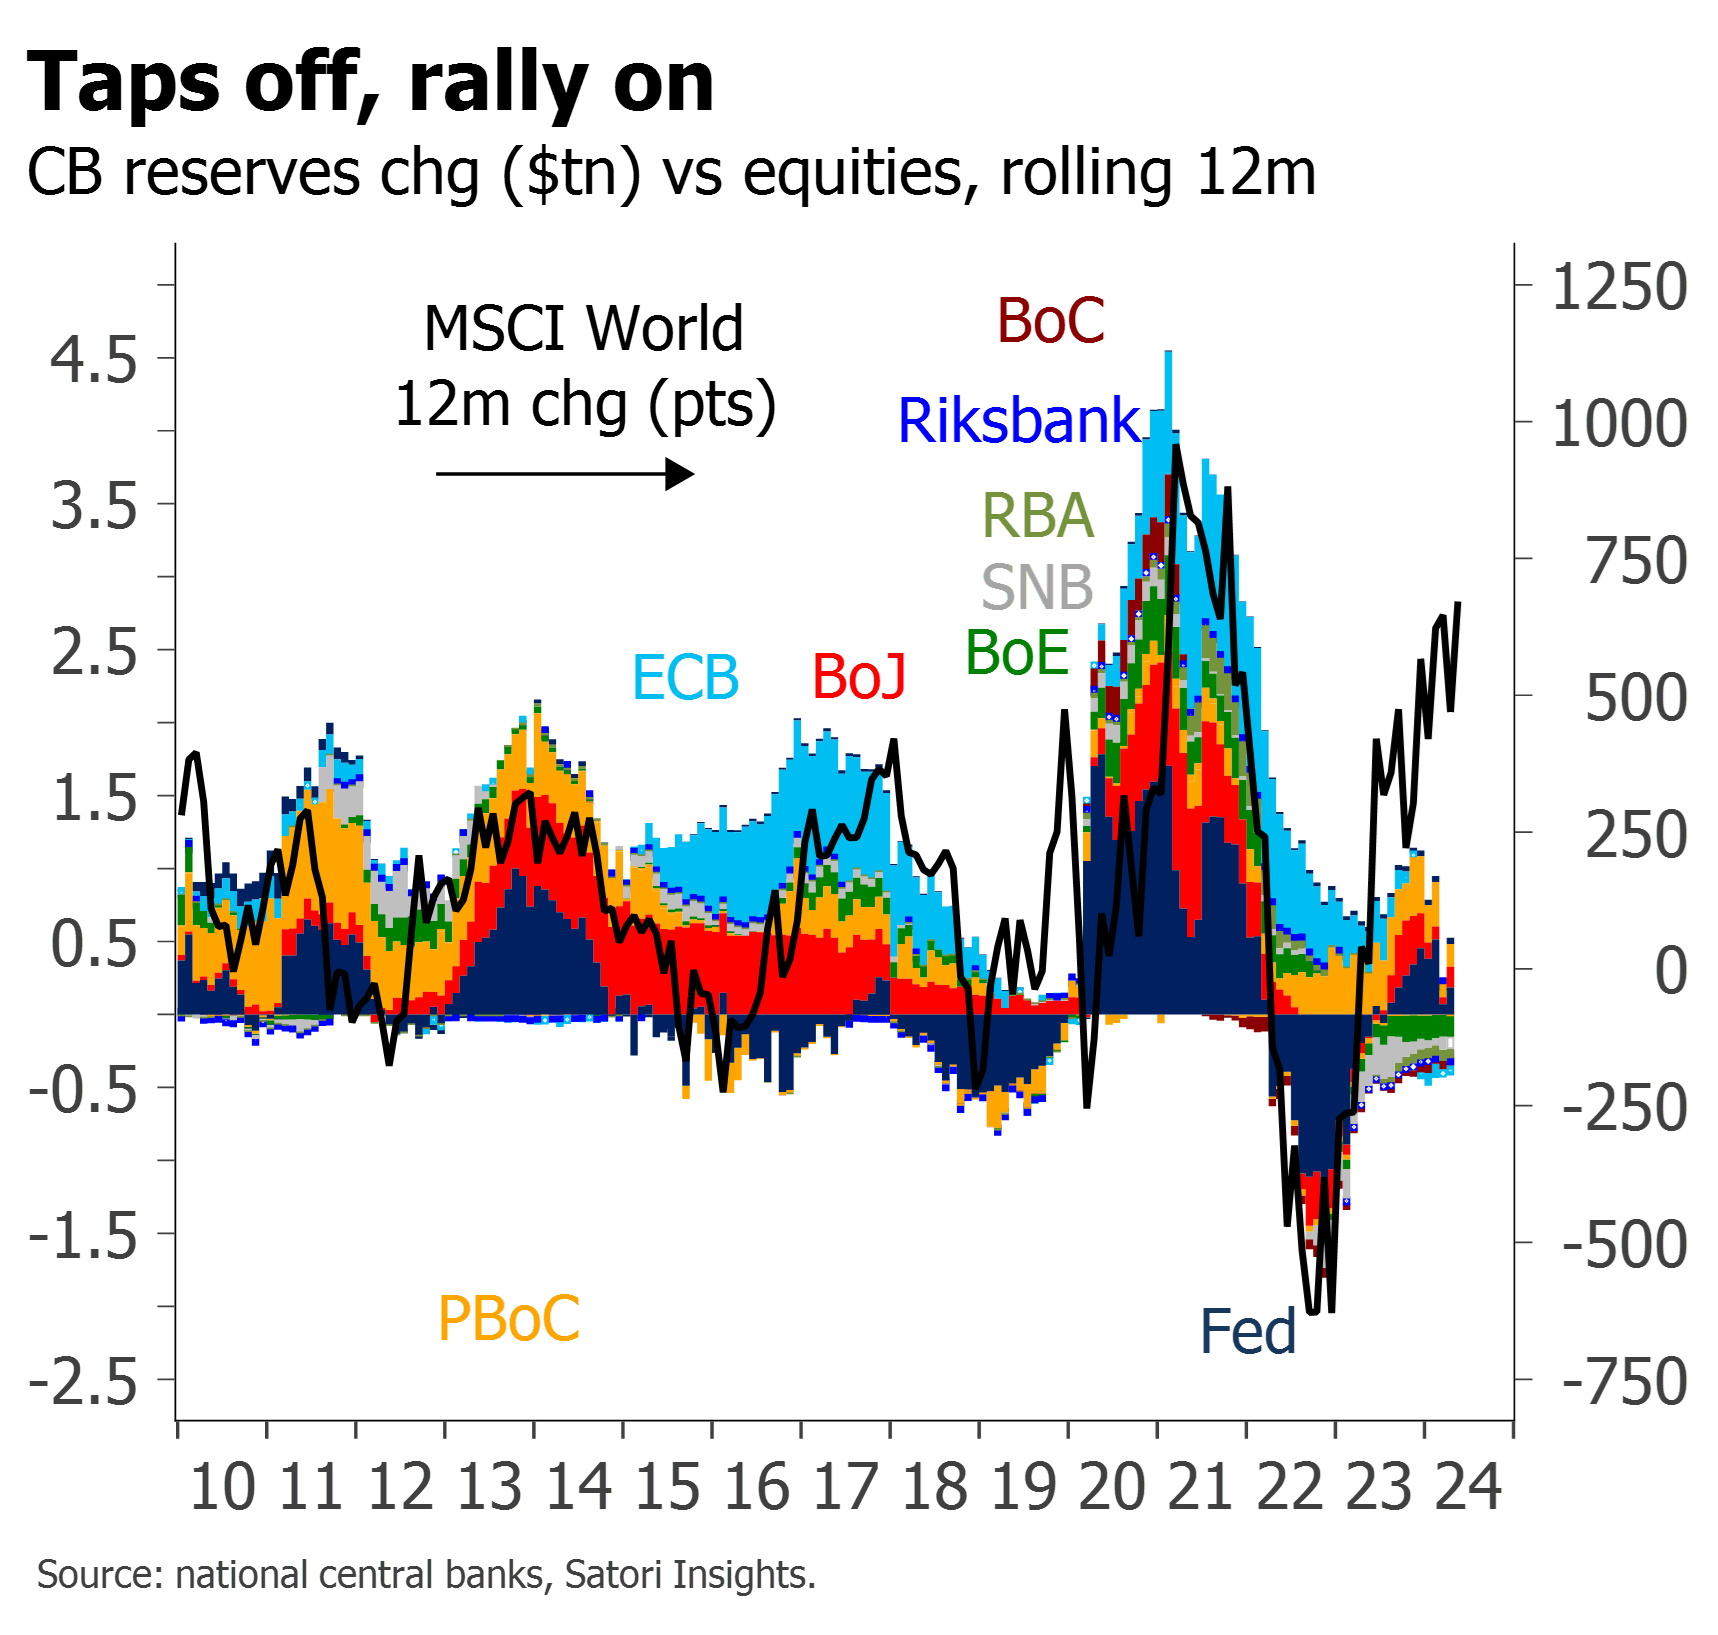
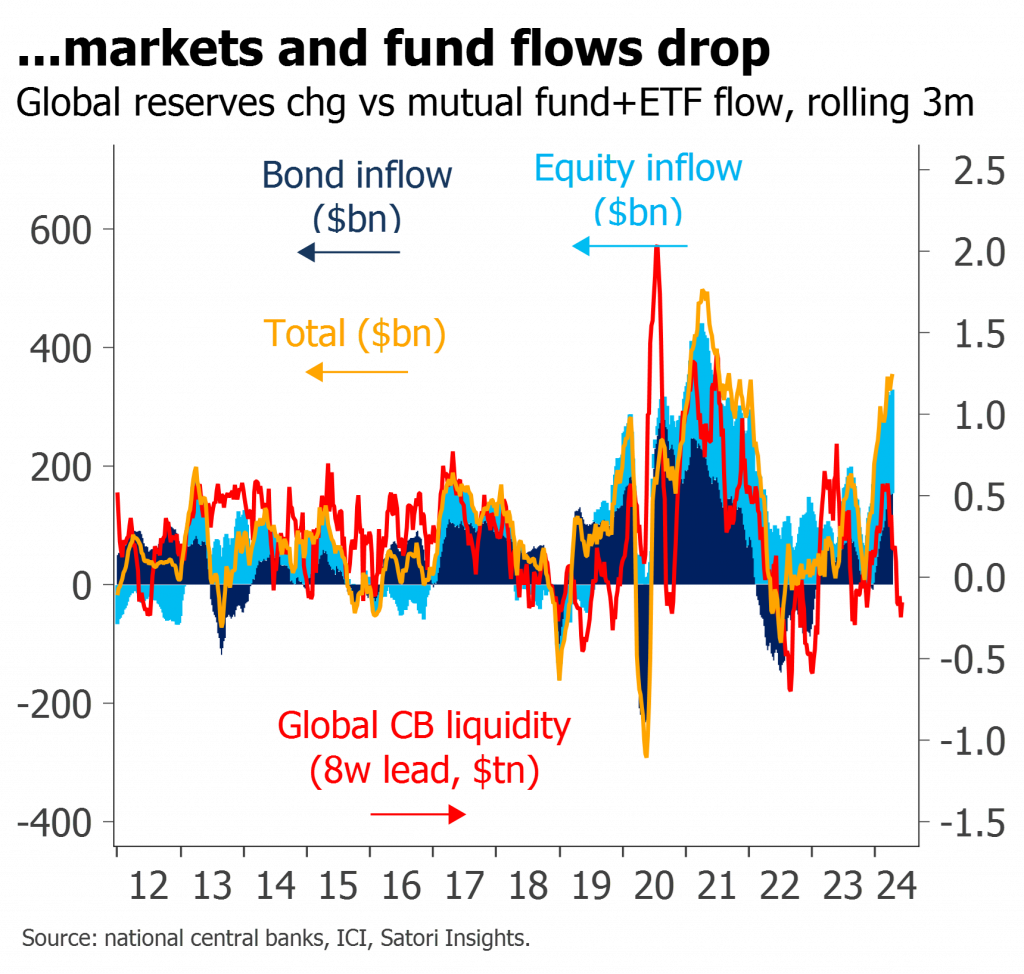
It has been aided by record fund inflows and a spike in CB liquidity
But the details of both the flows and the liquidity leave us skeptical
Expect the rotation to continue, but not the rally
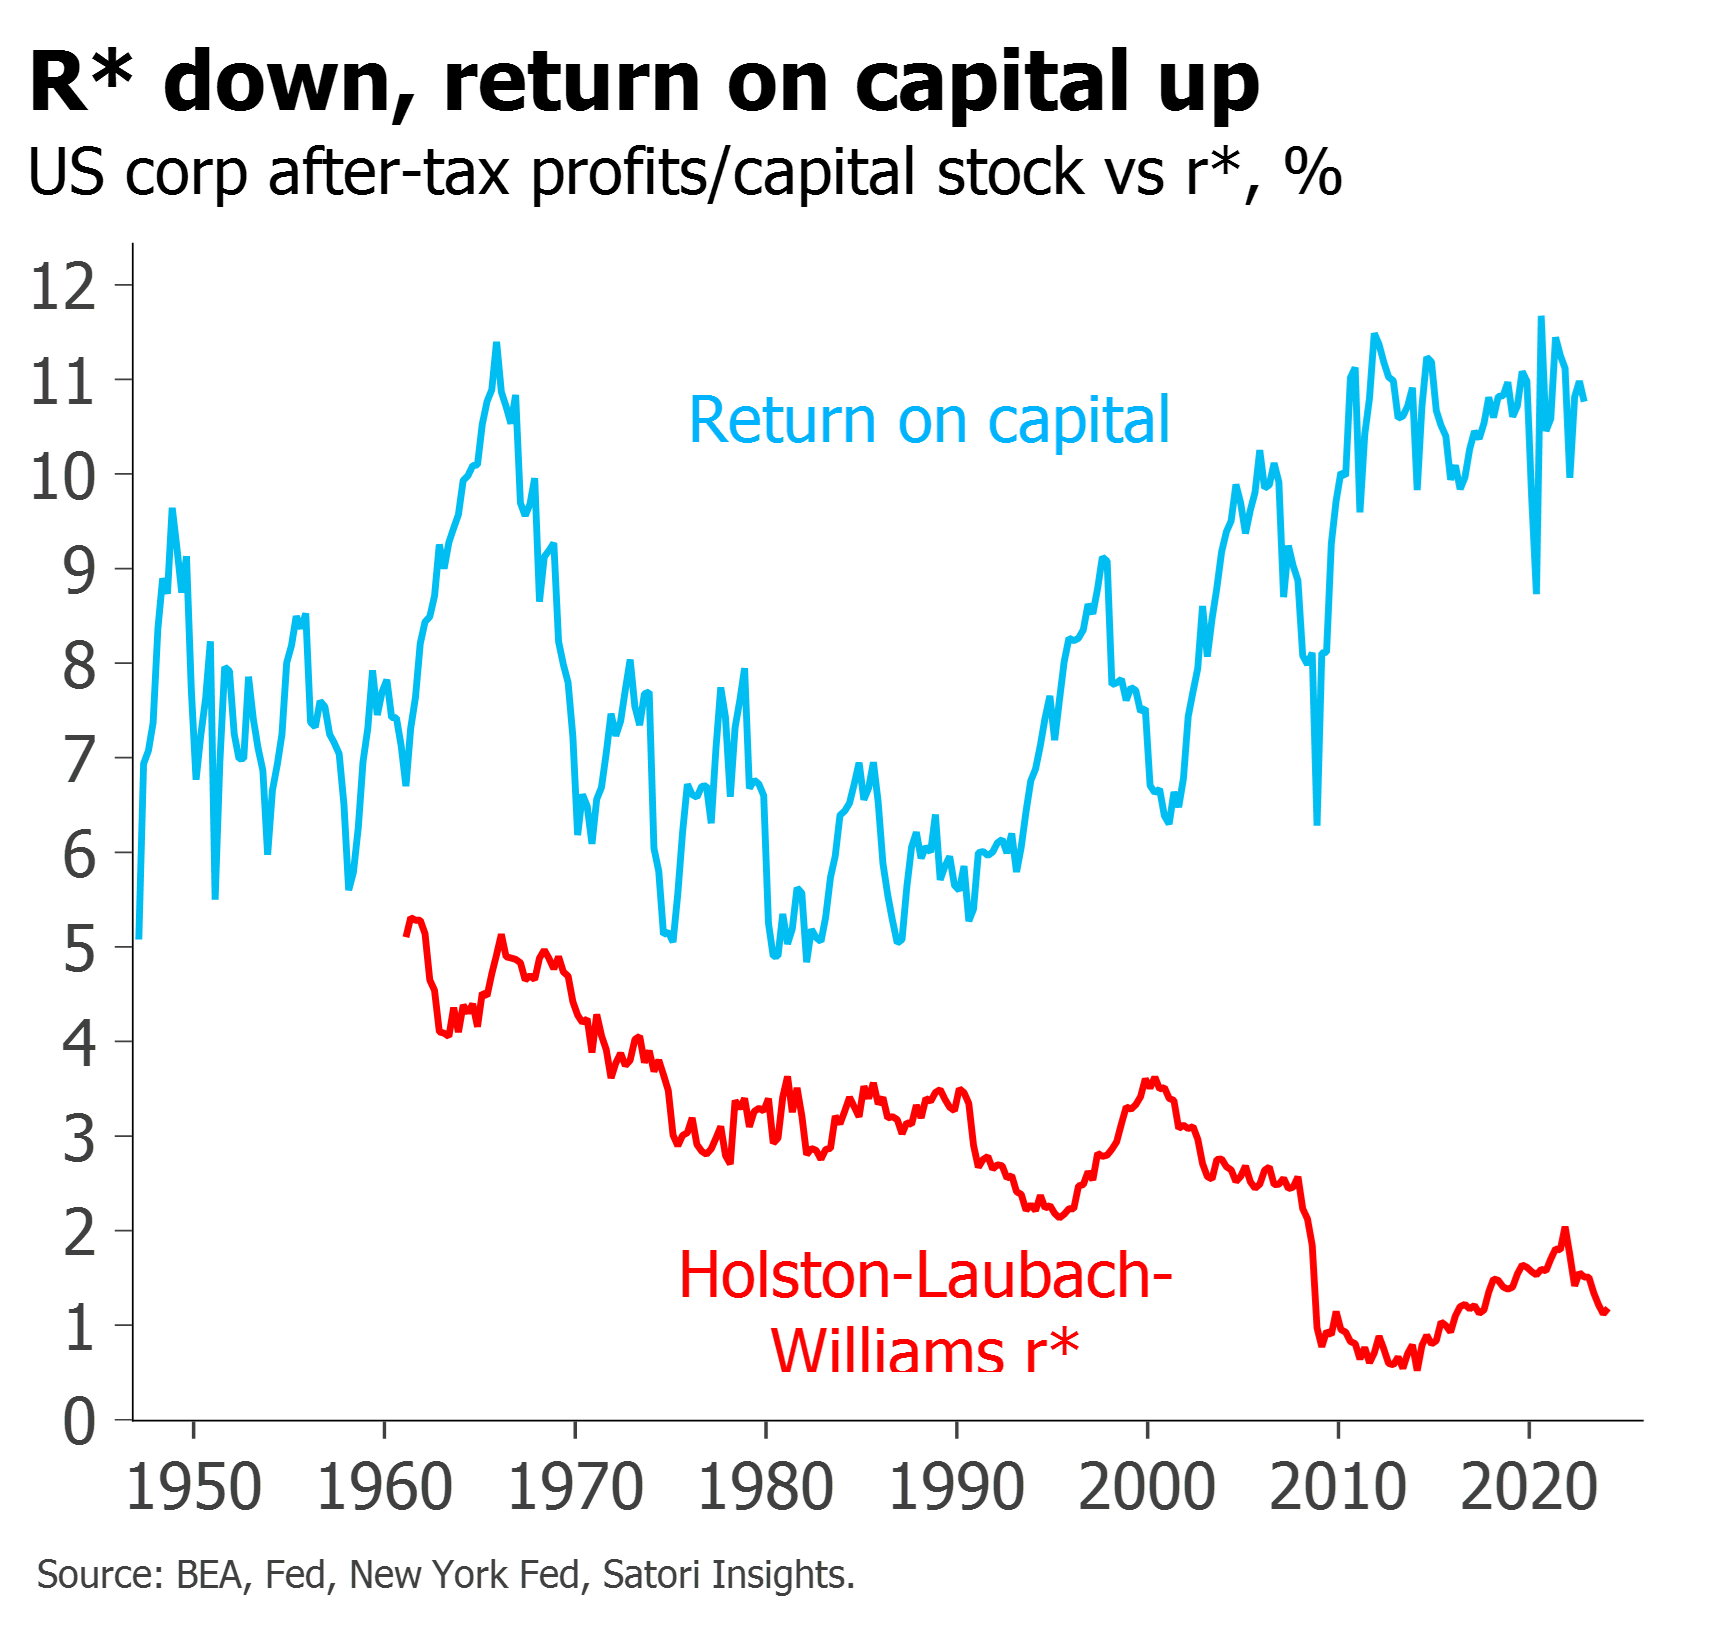
Recent statements are a reminder of the importance of neutral rates for policymakers
But they also illustrate confusion – not only about the level of r*, but even as to what it is supposed to be measuring
At the heart of the confusion lies a failure to distinguish between the impact of balance sheet on markets, and of rates on the economy
This potentially leads to very different conclusions for r* and policy
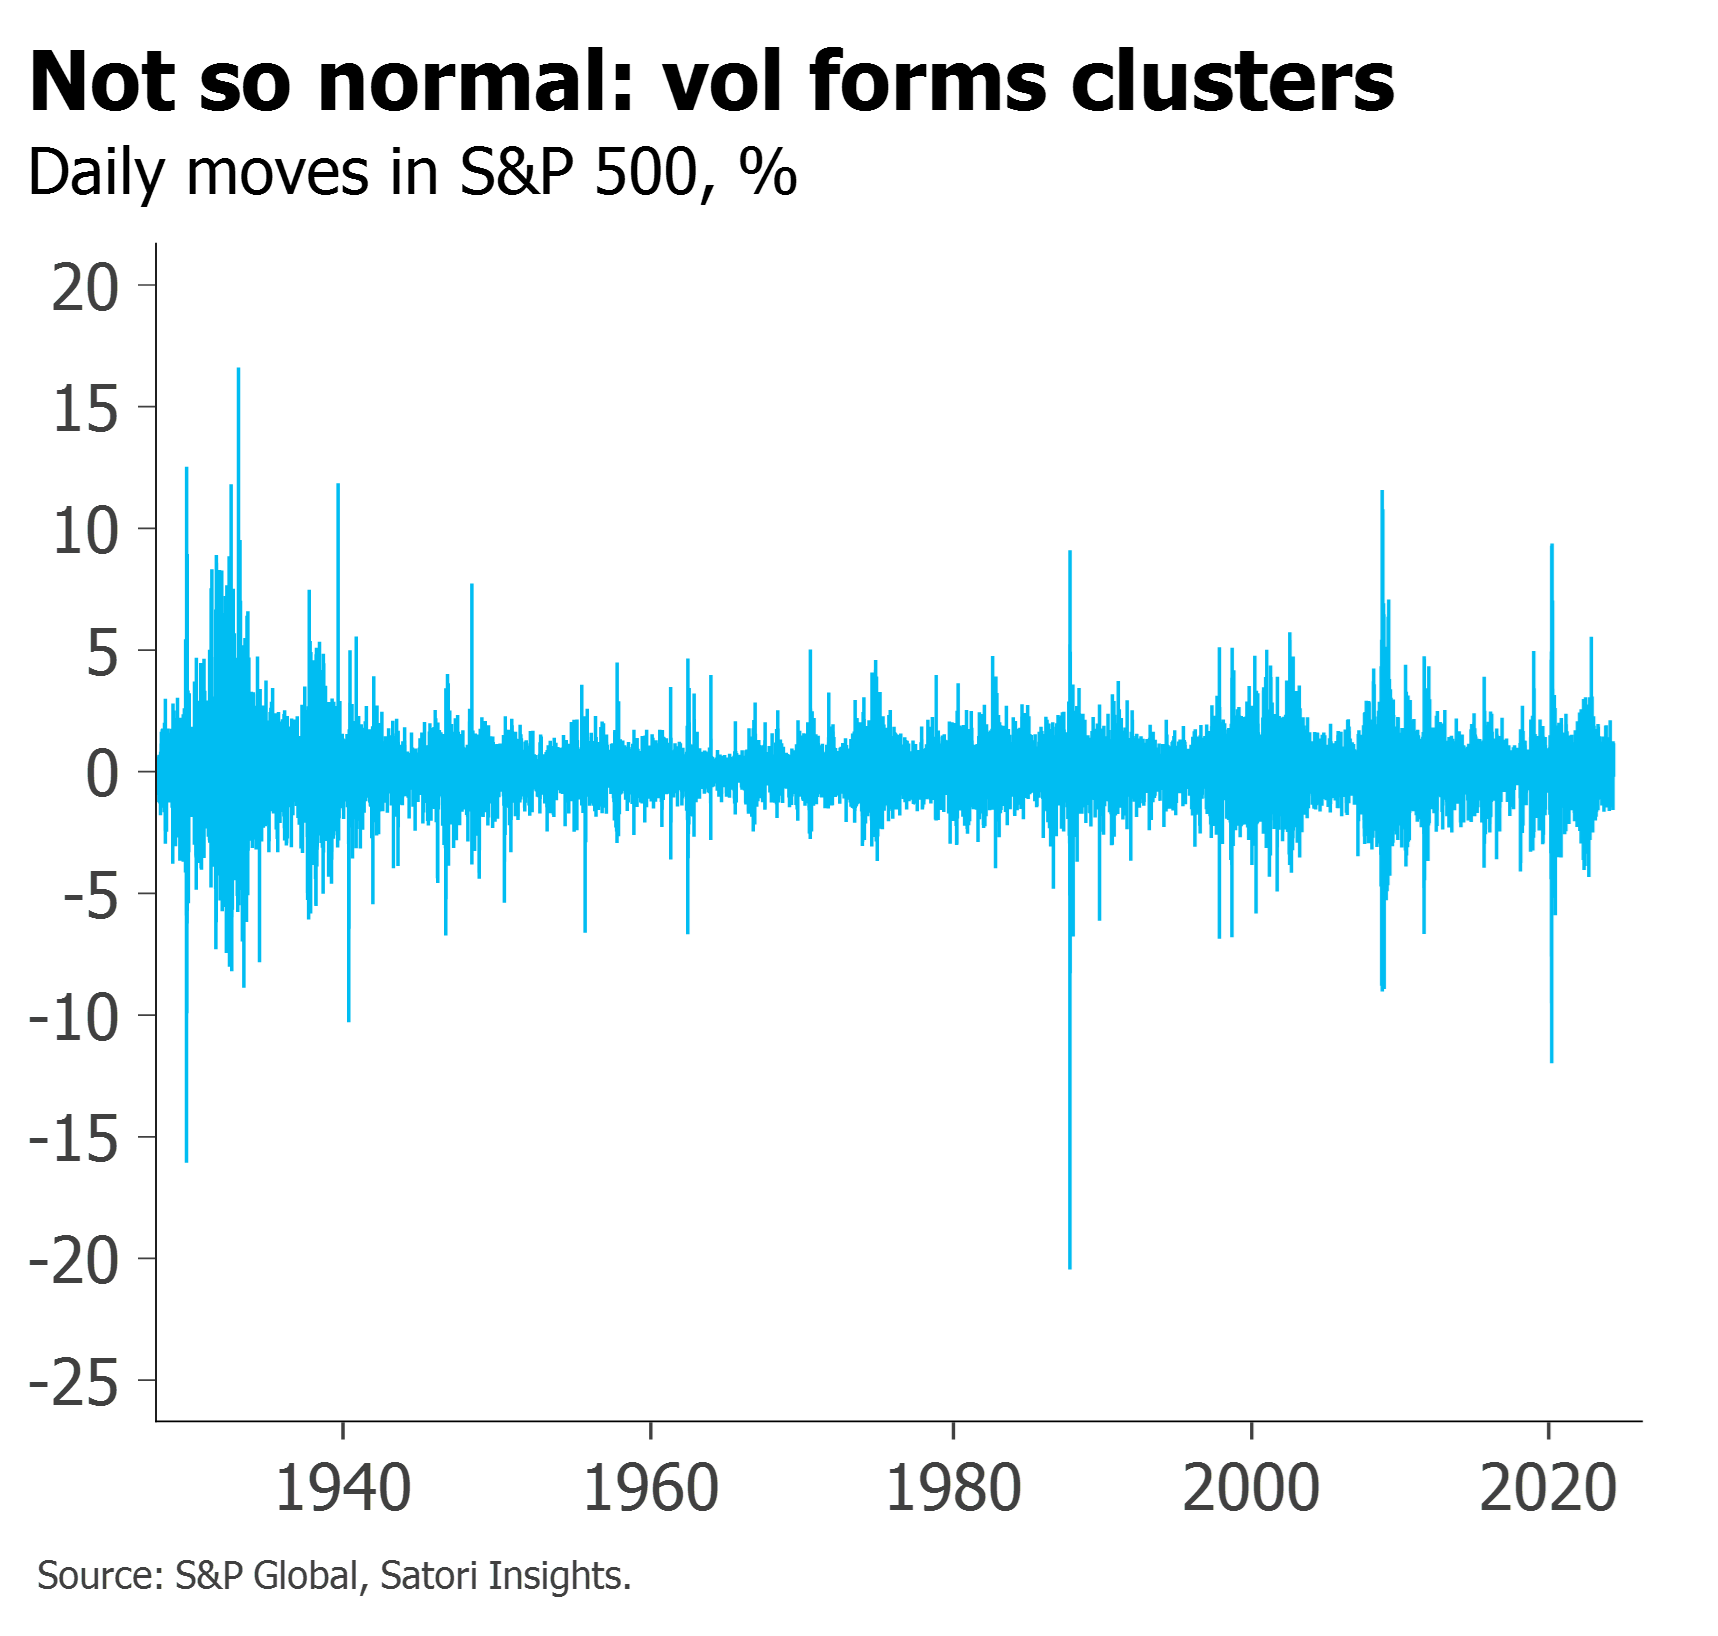
Markets and economies should be analyzed as ‘complex systems’
Their fat tails and emergent behaviours fit poorly with traditional linear economics, but very well with complexity modelling techniques
Lessons from other complex arenas apply equally well to investing
We have been arguing markets face greater risk of melt-up than melt-down
But the speed and extent to which many levels are deviating, not only from fundamentals but even from many technicals, is striking
Expect fund inflows to continue to swamp such concerns – but watch for any sign of faltering
The significance of last week’s FOMC lies neither with the rate view, nor with the earlier, larger taper of QT – mildly bullish though both of these are.
It comes instead from the stark asymmetry of the response function which was described.
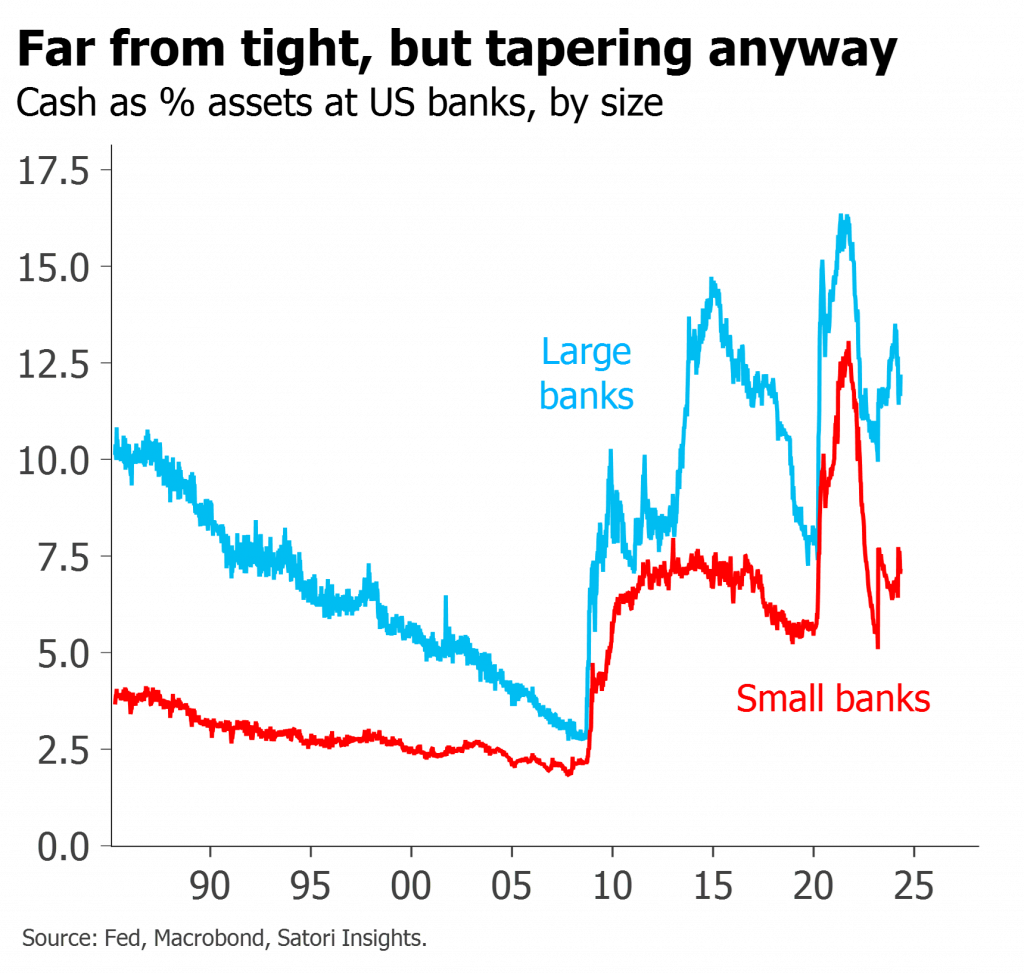
While the true test remains with the details of the liquidity outlook, in conjunction with the Treasury refunding this opens the door to a continued cross-asset rally through Q2.
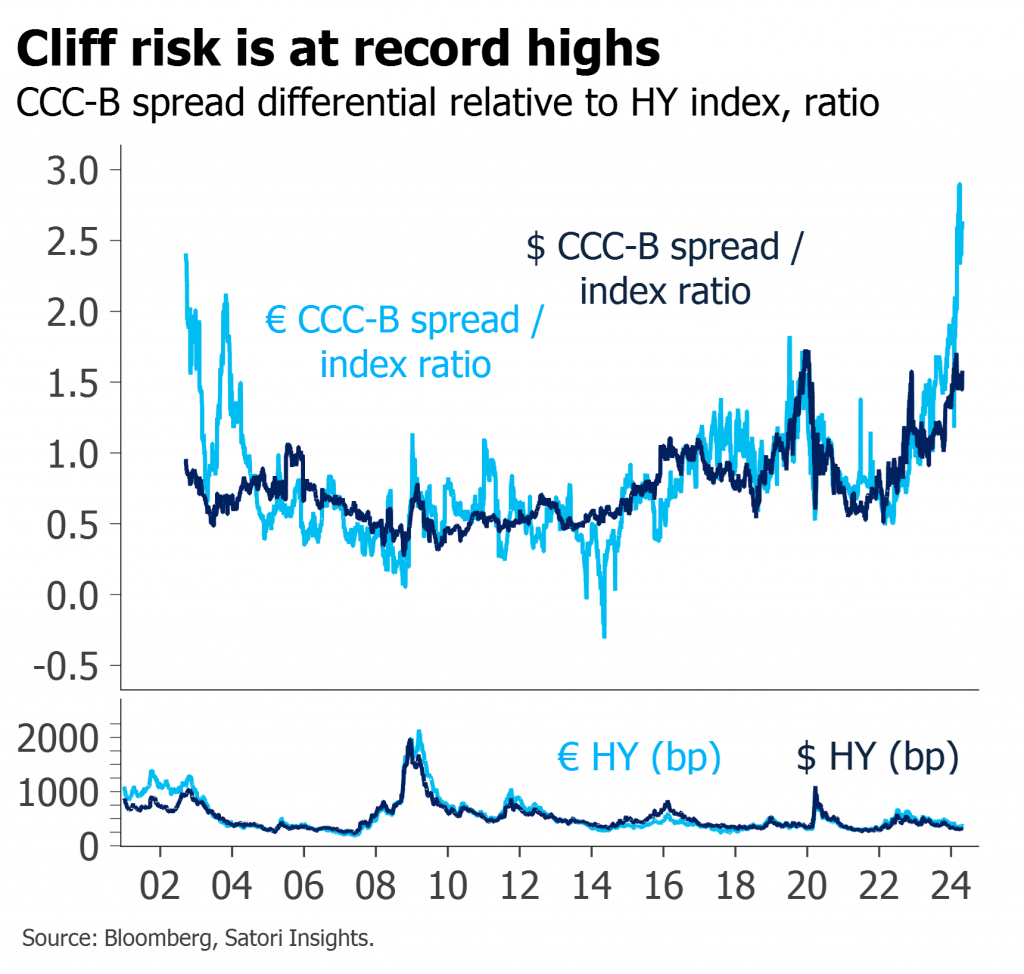
Relative CCC cliff risk has risen to record highs
This partly reflects hidden idiosyncratic risks from low recoveries and abandoned covenants
But mostly it signifies the macro suppression of index spreads
The $280bn weekly drop in Fed reserves is the largest since Apr22
Just as then, it coincides with a correction in markets
A drop in fund inflows seems likely to follow
But this still feels more like seasonal correction than decisive turn
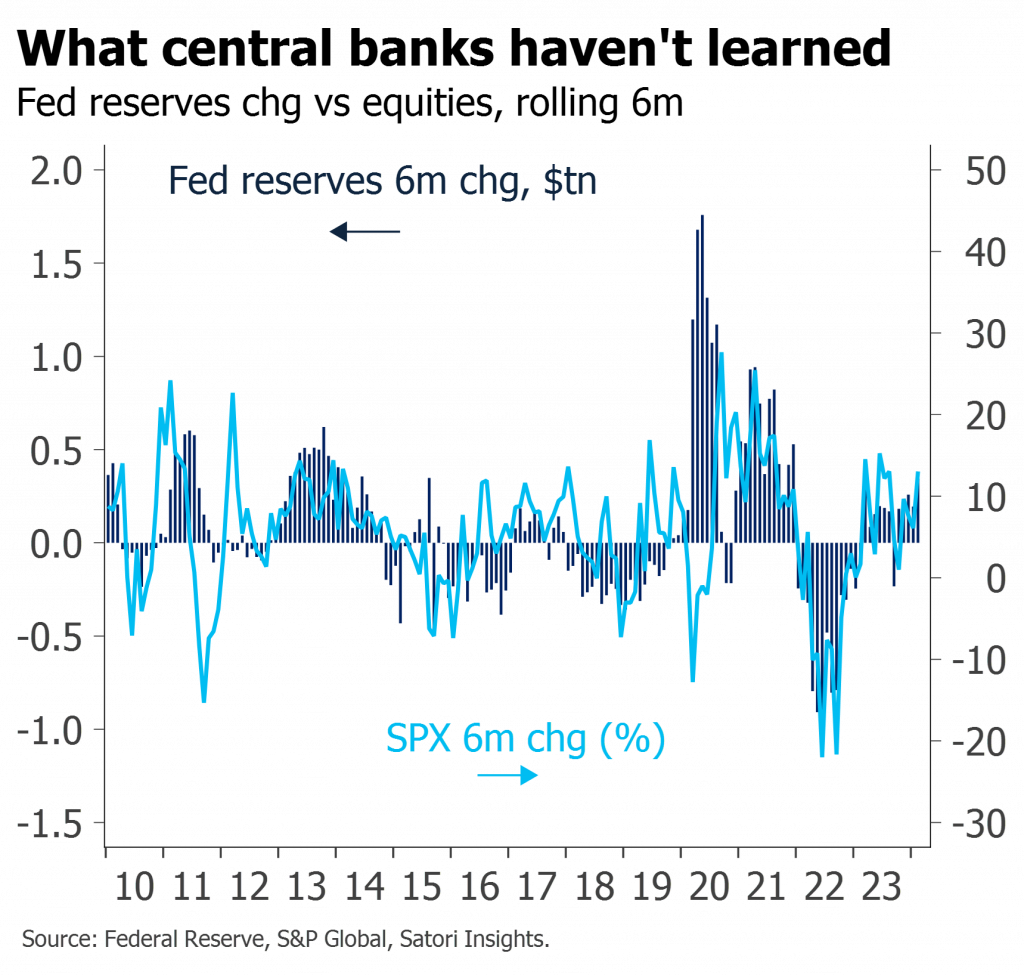
The latest central bank research on QT is careful, rigorous, and grounded in the literature
Unfortunately its main conclusion – that QE affects markets while QT doesn’t – is at odds with the lived experience of most market participants
There is a much simpler reason why QT has had so little apparent impact
Misunderstanding of this dynamic greatly contributes to the likelihood of future policy mistakes
The rally in risk is often attributed to strong earnings
But calendar earnings estimates have mostly been falling
Macro drivers, not organic estimate optimism, are the true source of the markets’ strength
After several months of liquidity tailwinds, risk asset pricing is starting to look excessive
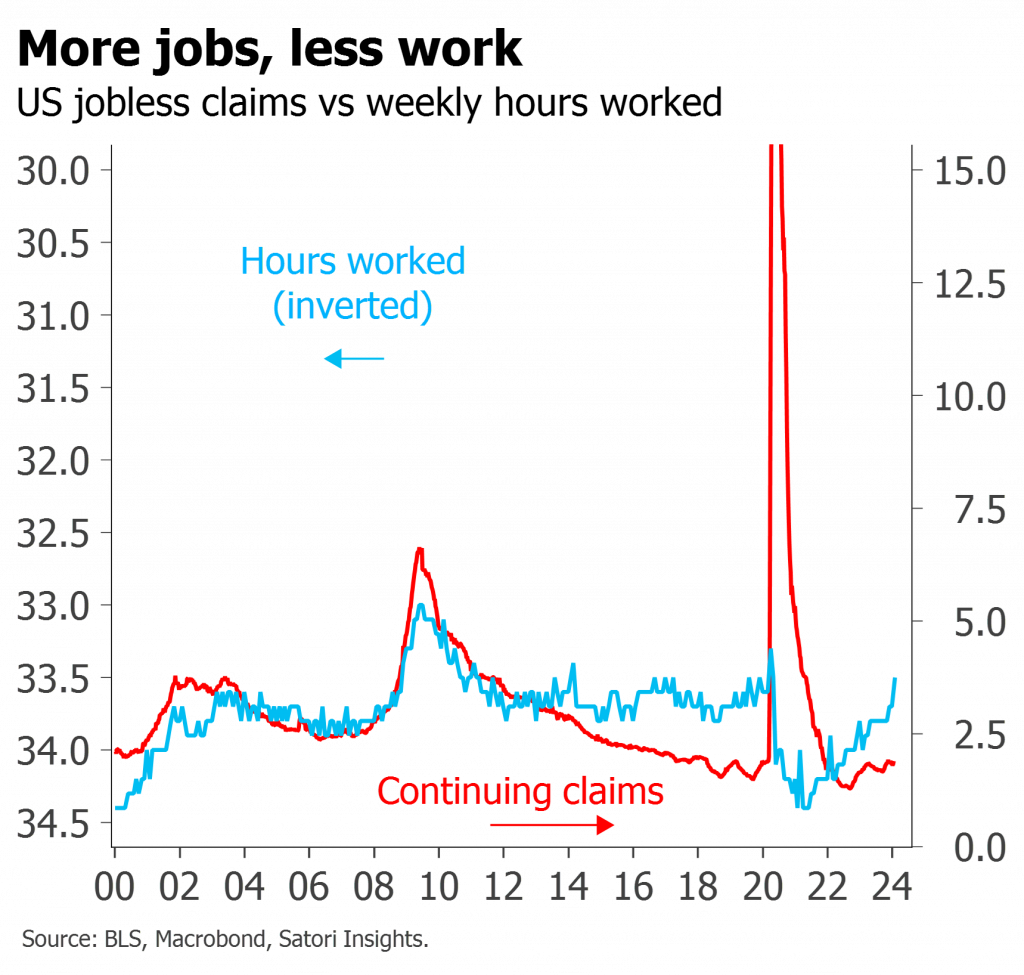
Improving spending, orders and hiring are all positives
Despite this, earnings estimates are falling
Fundamentals are reflective more of sticky supply than of dynamic demand
Ongoing price pressures may well curtail central banks’ desire for dovishness
But excitement about higher r* remains overdone

